
Research Projects
Double strand of DNA & Global or Local effects
Understanding the impact of the environmental effects on mechanical and physical properties of DNA stay a decisive challenging to well understanding living cells. As everybody knows, DNA is an essential component of the cellular machinery, playing a crucial role in lot biological processes such as transcription or replication. As explain in From the DNA molecule to the chromatin fiber inside cell nucleus section, DNA adopted a lot of conformation from the commonly-know double helix form to packaging chromosome form.
It was experimentally found that DNA is a polymer which can stiffen, abruptly bent or be partially denatured in function of its sequence. This local events radically alternate the physicals properties of the DNA molecular in term of flexibility and elasticity.
Better understanding the physics of this molecule is crucial. In those framework studies, we develop tools to quantify, both experimentally and theoretically the impact biochemical changes and intrinsic DNA characteristics on the mechanical properties of a DNA molecule.
All project focusing on the double stranded DNA molecule using the Tethered Particle Motion (or TPM) method and Monte Carlo simulations mimicking the experimental setup in order study the DNA behavior and its properties.
Experimental approaches
TPM is a experimental single molecule technique which consists in grafting one end of the DNA molecule (of length LDNA) on a substrate and a nanometric particle (with a radius Rpar) at the other end. The complex DNA-particle is free to fluctuate in solution. Moreover, the IPBS group in Toulouse, which has a recognized expertise in TPM techniques, has developed a biochip of high-throughput High-throughput (ht-TPM), that enables the high parallelization of TPM and the analysis enough molecules simultaneously (Plénat T., et al.).
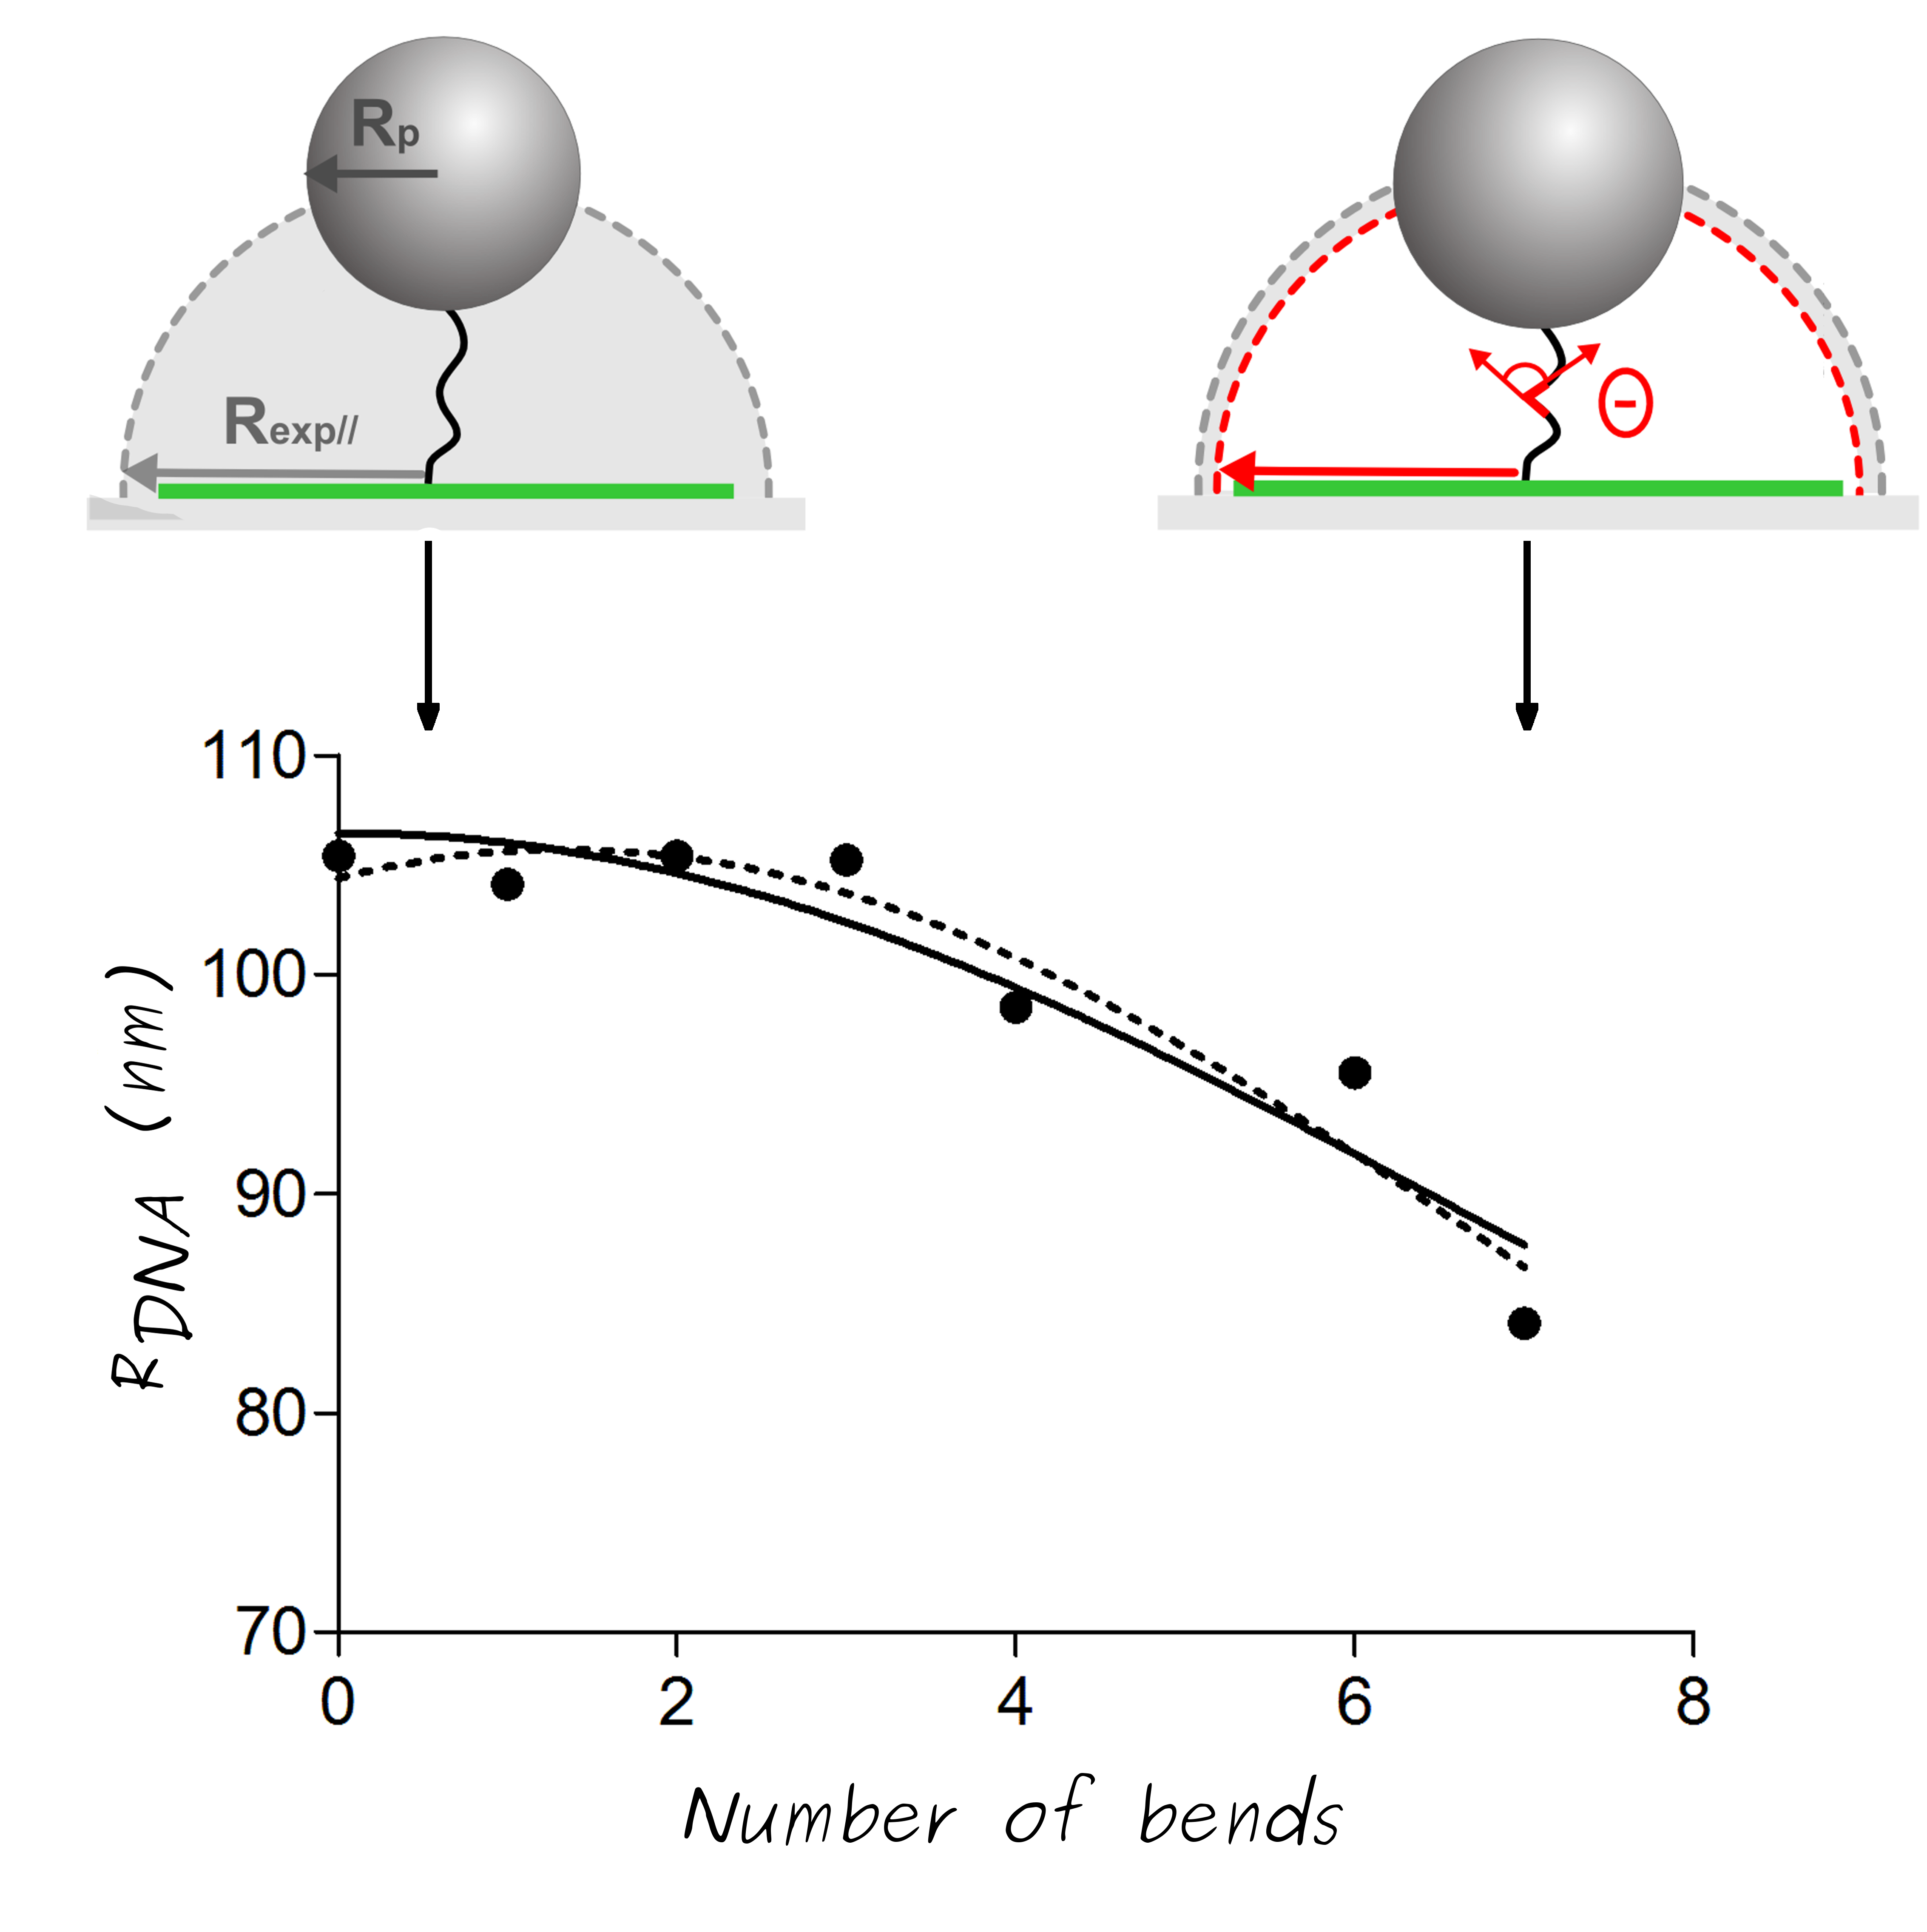
Tethered particles can be visualized (simply by dark-field microscopy) and its motion over time is followed. In that way, the 2D projection of the bead displacement relative to the anchoring point of the DNA molecule gives access to its root-mean-squared end-to-end distance projected on the grafting surface, noted Rexp||, also called amplitude of motion. The amplitude of motion directly depends on the apparent length of the DNA molecule, reflecting biophysical properties of the DNA molecule, conformational changes, molecule stiffness.
The TPM technique is well adapted to address questions concerning conformational changes of the DNA molecule such as curvatures, or denaturation bubble formation. Since conformational degrees of freedom are not hampered by any external constraints with TPM method. The use of a biochip, ht-TPM technique, enables the parallelization of DNA/particle complexes and the tracking of conformational dynamics of hundreds of single DNA molecules in parallel. This biochip ensuing high-throughput data acquisition, allows to obtain a large accumulation of individual statistics that permits to get results with a good accuracy.
Numerical approaches
Performing Kinetic Monte Carlo simulations on the particle-DNA complex enables predicting the particle to anchor 2D-distance. The current simulation model is based on statistical model of polymer described at the mesoscopic scale (Manghi M., et al.). To simulate the TPM geometry, the DNA-particle complex is model as a chain of N connected small hard spheres/beads (from 25 to 50 beads) of radius a=2nm and a larger final particle of radius Rpar. Numerical displacement of the labeled particle is obtained using Monte Carlo algorithm. The internal structure of the double-stranded DNA is not considered at this level of modeling. In addition, the polymer motion is limited to the upper half-plane, impose by hard-wall boundary conditions and the first joint is considered as a freely rotative joint to the glass coverslip (Soel L., et al.), (by fixing the first sphere center at a height above the surface).
The 2D-vector of the particle position is measured throughout simulations and utilized to estimate the amplitude of motion and average being taken along the trajectory. The resulting Rsimu|| from the simulations, would be compare at the Rexp|| from TPM experiment measurements.
Theoretical approaches
The calculation of the root-mean-square end-to-end distance of the DNA molecule RDNA from the Rexp|| or Rsimu|| requires an appropriate theoretical model and to be corrects form the effects of the particle
With the classical Worm-Like chain model (Kratky, O. and Porod, G.), the amplitude of motion of the DNA-particle complex, which taking into account the persistence length of the DNA, derived from the 〈RDNA2〉calculated for an isolated DNA molecule:
The analyze of the particle position at equilibrium (thought the distribution/histogram of 2D projected particle displacement) exhibit strong agreement between experiments and simulations (for similar LDNA and Rpar , of courses )
Local intrinsic DNA bending
Combining experimental, numerical and theoretical tools allows us to develop a method of evaluation and quantification of local DNA bending angles. DNA bending can be induced either by specific intrinsic sequence, or by the binding of proteins along the DNA. Here, we exploited the specificity of PolyA DNA sequences. Constructs made of 575 base-pair DNAs with assemblies (in-phase or in opposition of phase) of one to seven sequences CAAAAAACGG, (6A), are used. The central region of the DNA molecule contains n copies of a 6A sequences, which are predicted to be bent.
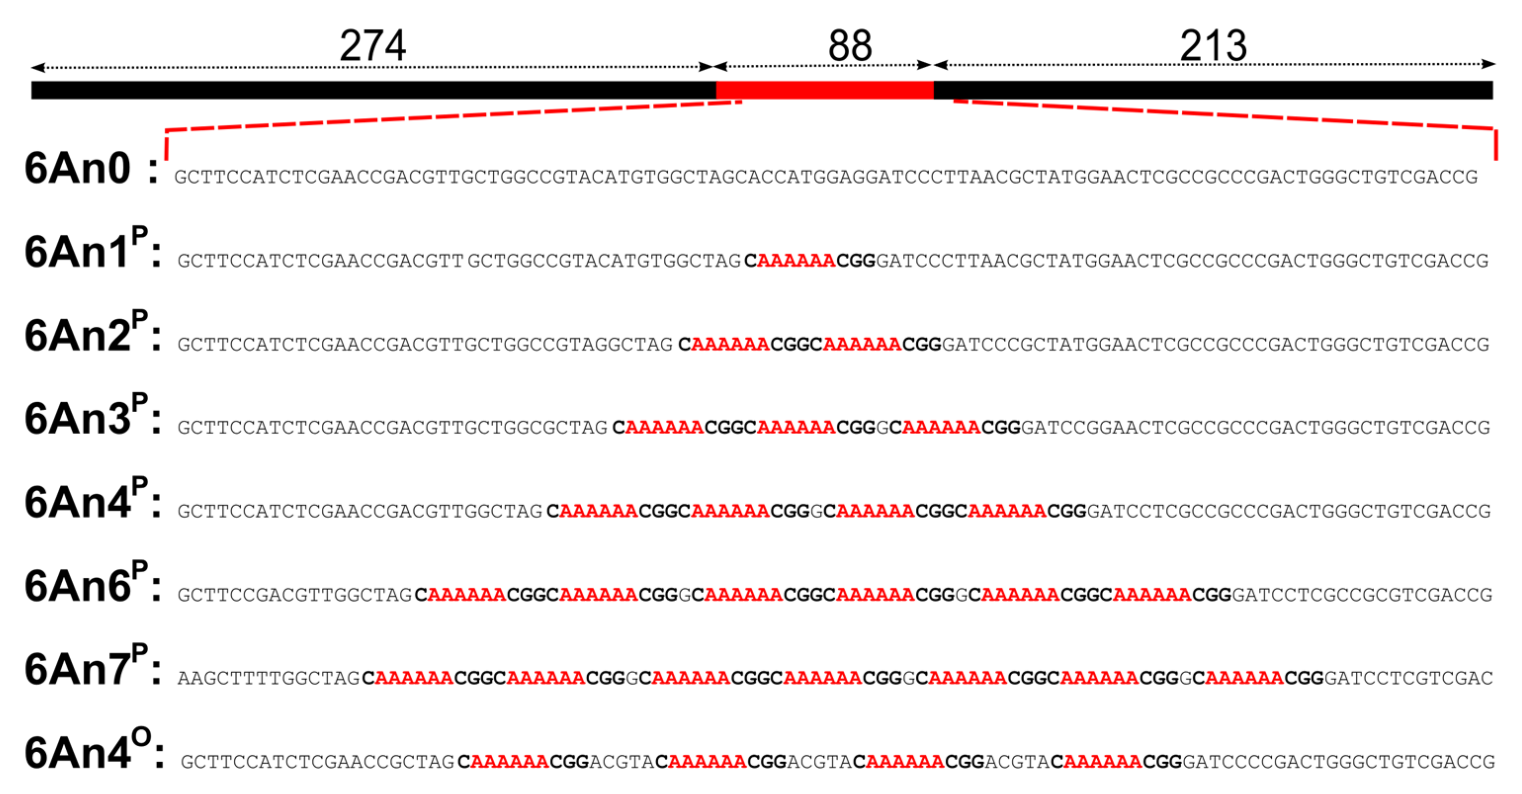
We proposed a theoretical description of the polymer chain, named "kinked Worm-Like Chain", (kWLC) in order to evaluate the global bending angle θ induced by 6A-tract assemblies sequences. First, this kWLC model is used to fit simulated ht-TPM amplitudes of motion Rsimu|| in the present context. We assume then that each of the n successive 6A-tracts inserts in-phase imposes the same bending angle θ1 and postulate as a first order simplification hypothesis that θ=nθ1. The extrapolated fitting parameters leads to a simple formulation of the end-to-end distance of DNA molecules.
This simple equation allowing to extract local bend angles from ht-TPM measurement. As a result, we find that one 6A sequence induces a bend angle of 19◦ ± 4◦ in agreement with other value from the literature.
Find the detailed study in the publication : Brunet, A., Chevalier, S., Destainville, N., Manghi, M., Rousseau, P., Salhi, M., Salomé, L., Tardin, C., Probing a label-free local bend in DNA by single molecule tethered particle motion, Nucleic acids research, DOI: 10.1021/acs.macromol.5b00735. Clic here for the pdf
Global ionic strength conditions
The ionic strength, I, depend on surrounding ions in solution and induce changes in the DNA polymer stiffness/rigidity, characterized by the DNA persistence length, Lp. Using ht-TPM single-molecule experiments, Lp of two DNAs, of 1201 and 2060 bps, is measured in solutions for a large of well-controlled ionic strengths range, from I=10-2 to 3 mol/L with Na+ and with or without Mg2+ ions.
Numerical simulation permit us to refine the persistence length extraction way from experimental data in order to accurately determine Lp values. Since at this level of coarse-graining, electrostatic interactions are not included, we varied the bending modulus of the simulated DNA by hand such that Lp spans the range 36−70 nm. This reflect the stiffening due to the decrease of the ionic strength in the solution. Moreover the presence of the particle that interacts with both the substrate and the chain induces a non-constant shift to higher values of Rsimu||. To better take into account the substrate−particle interactions, the simulated data are fitted by a quadratic polynomial law. Then this polynomial law is used to determine Lp from Rexp|| collected from ht-TPM experimental data (meaning resolving inverse problem to extract Lp).
This quantification of Lp dependence, on a large and strongly prospected range of ionic strengths, exhibit higher Lp at low ionic strengths (meaning DNA molecule is more rigid) and lower Lp at high I (meaning the DNA molecule is more flexible when the solution is more salty). Indeed, a rise in I provokes an increasing screening of the repulsive phosphate ions of the backbone, which leads to a more flexible DNA chain
Several theoretical equations forLp (I) are fitted to the ht-TPM experimental data. Among the different theories developed to explain the variations of Lp with the ionic strength, I, the most famous is the Odjik−Skolnick−Fixman (OSF) theory, (Odijk T. and Skolnick J. and Fixman M.). In addition, the first Manning theory, (Manning G.S.), which take into account counterion condensation around the DNA at low I, was compared to experimental data. Unfortunately, no decisive theory is found which fits all the Lp values for the two ion valencies. The second theoretical approach proposed in 2006 by Manning G.S., tend to explain Lp (I) variation in presence of monovalent ions Na+ only.
We explore a variation approach by proposing an interpolation formula that fits all our experimental Lp over the complete range of probed ionic strength and for the two ion valencies :
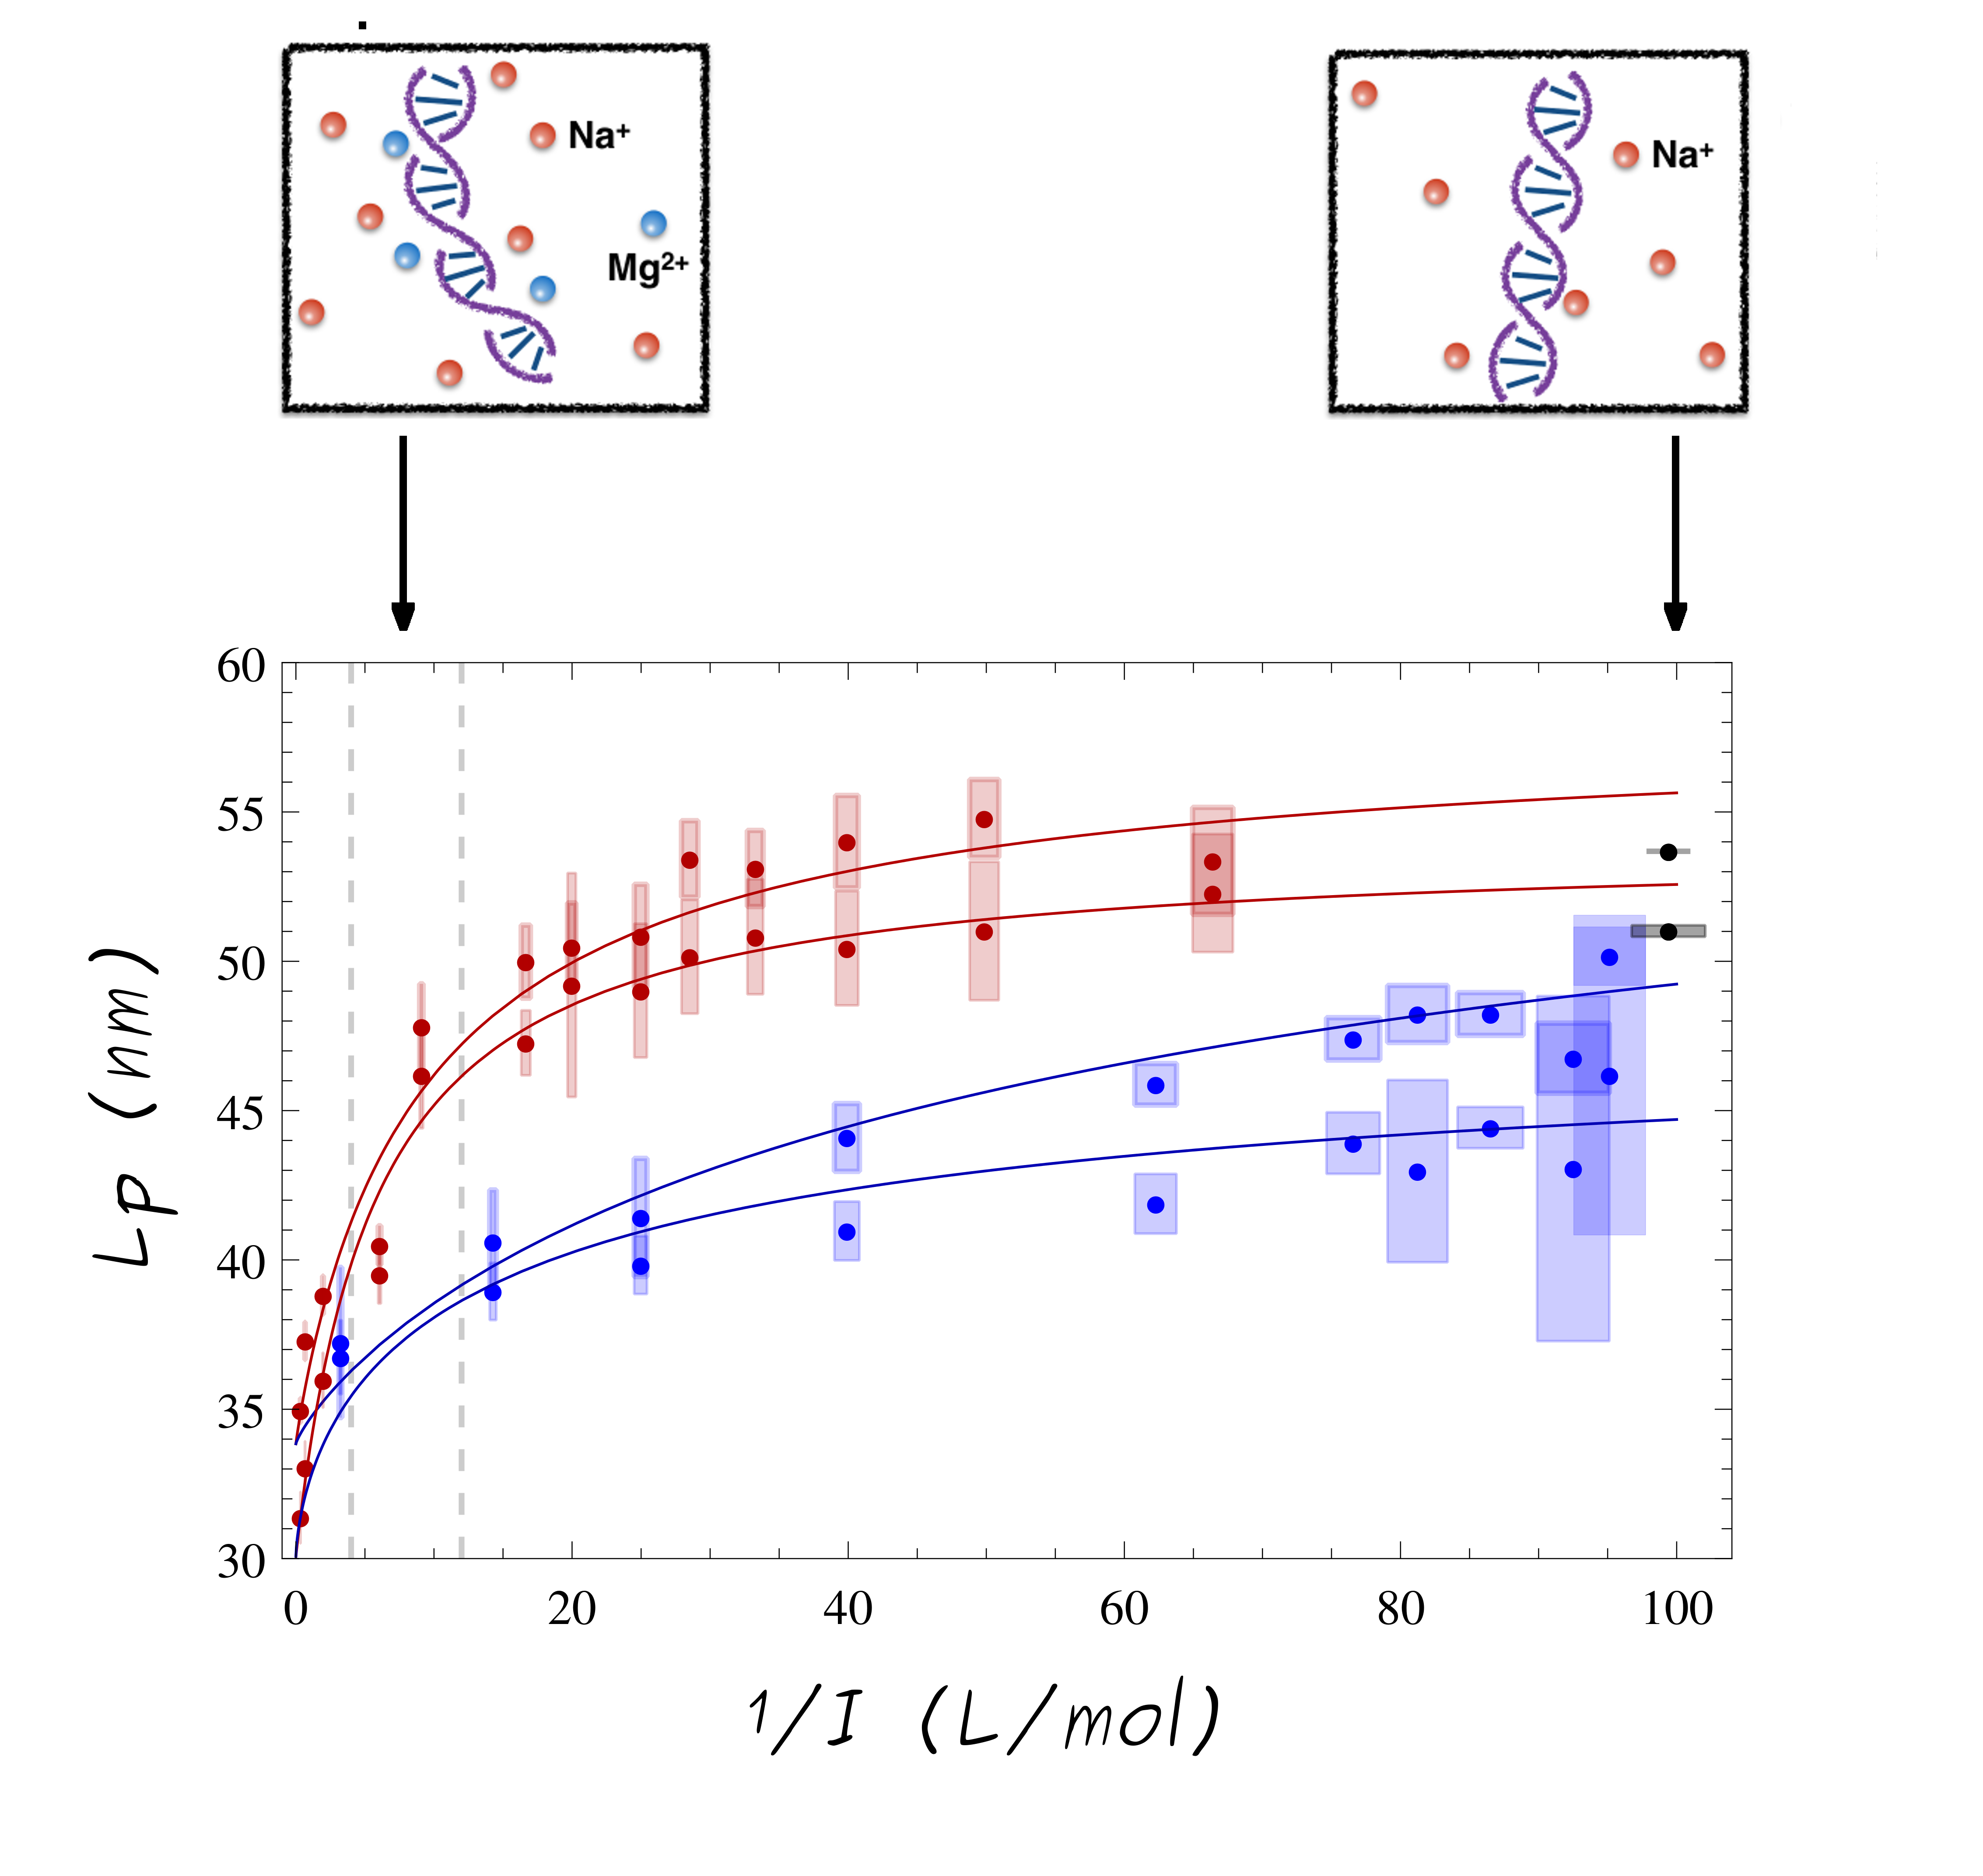
The extracted Lp values of ht-TPM measurement decrease from 55 to 30 nm when the ionic strength increases. A stronger decrease was observed in presence of divalent ions Mg2+ than with monovalent ions Na+. The fits with this extrapolated formula are in good agreement with experimental data for both Na+ and Mg2+ ions.
Find the detailed study in the publication : Brunet, A., Tardin, C., Salomé, L., Rousseau, P., Destainville, N., Manghi, M., Dependence of DNA persistence length on ionic strength of solutions with monovalent and divalent salts: a joint theory- experiment study, Macromolecule, DOI: 10.1093/nar/gkv201. Clic here for the pdf
Local & global temperature effect
This study take advantage of our capacity to detect subtle changes occurring on DNA by using ht-TPM over temperature range, to question the existence of bubbles in double stranded DNA under physiological salt conditions through their conformational impact on DNA molecules ranging from several hundreds to thousands of base pairs.
As long as the DNA keeps intact its double stranded structure, Lp varies as the inverse of temperature, assuming that its bending modulus depends only weakly on the temperature, T, (Wilcoxon J. and Schurr J.M.).
Rising temperature induces a significant decrease in the raw amplitude of motion of the DNA-tethered particle as well as in the relaxation time of the particle. We demonstrate that this latter effect combined to the limited capacities of the detector causes a significant experimental bias in TPM data. After correction, the amplitude of motion of the DNA-tethered particle exhibits only a slight decrease with temperature. Consequently, the DNA persistence length shows a limited decrease with temperature as expected for intact double stranded DNA molecules.

Under spontaneous thermal fluctuations, DNA base pairs may break to give rise to transient opening of the dsDNA. This local conversion of a few bp of dsDNA into two single stranded DNA (ssDNA) corresponds to the formation of the so-called DNA bubbles, which are ∼25 times more flexible than dsDNA (Pal T. and Bhattacharjee S.M. and Manghi M. and Destainville N.). We explore the influence of temperature on the mechanical characteristics of an internal sequence composed of 50 adenines (A50) more prone to denaturation than random sequences, and do not detect any temperature effect. Although our results seem at odds with recently published ones at first sight, we could clarify the reasons for these differences and show that our finding leave open the question of a biological impact of temperature on double stranded DNA.
Find the detailed study in the publication : Brunet, A., Salomé, L., Rousseau, P., Destainville, N., Manghi, M., Tardin, C., How does temperature impact the conformation of single DNA molecules below melting temperature? Nucleic acids research, DOI: 10.1093/nar/gkx1285. Clic here for the pdf
Chromatin fiber & Lamina-associated domains
As explain in From the DNA molecule to the chromatin fiber inside cell nucleus section, the current views of the three-dimensional (3D) genome inside the nucleus of cell is not random but depict a hierarchical architecture of the genomic material.
Much of our knowledge of the genome however still depends on a one-dimensional, linear, representation of a reference genome. It is now clear though that 3D analyses of the genome, enabled by development of wet-lab and computational methods enhance, the information content of genomic studies and give new insights into gene regulation and disease mechanisms (Dekker et al.). For example, genomic characteristics identified and mapped onto a linear genome may be differentially organized in the 3D nucleus space; this may result in interpretations of these features that are not visible in one dimension.
Combining experimental data and big data analyzing to probes 3D conformation of the chromatin fiber inside the nucleus
Topological associated domain, TAD
The mammalian genome is organized into compartments of active and inactive chromatin (Lieberman-Aiden E., et al.,) and within these, regions of high-frequency chromosomal interactions termed topologically-associated domains (TADs). TAD are typically 10kb to 1-2 Mb, have well defined borders (or boundaries) along the linear genome, which are enriched in binding sites for cohesin and the chromatin insulator protein CCCTC-binding factor (CTCF).
Lamina-associated domain, LAD
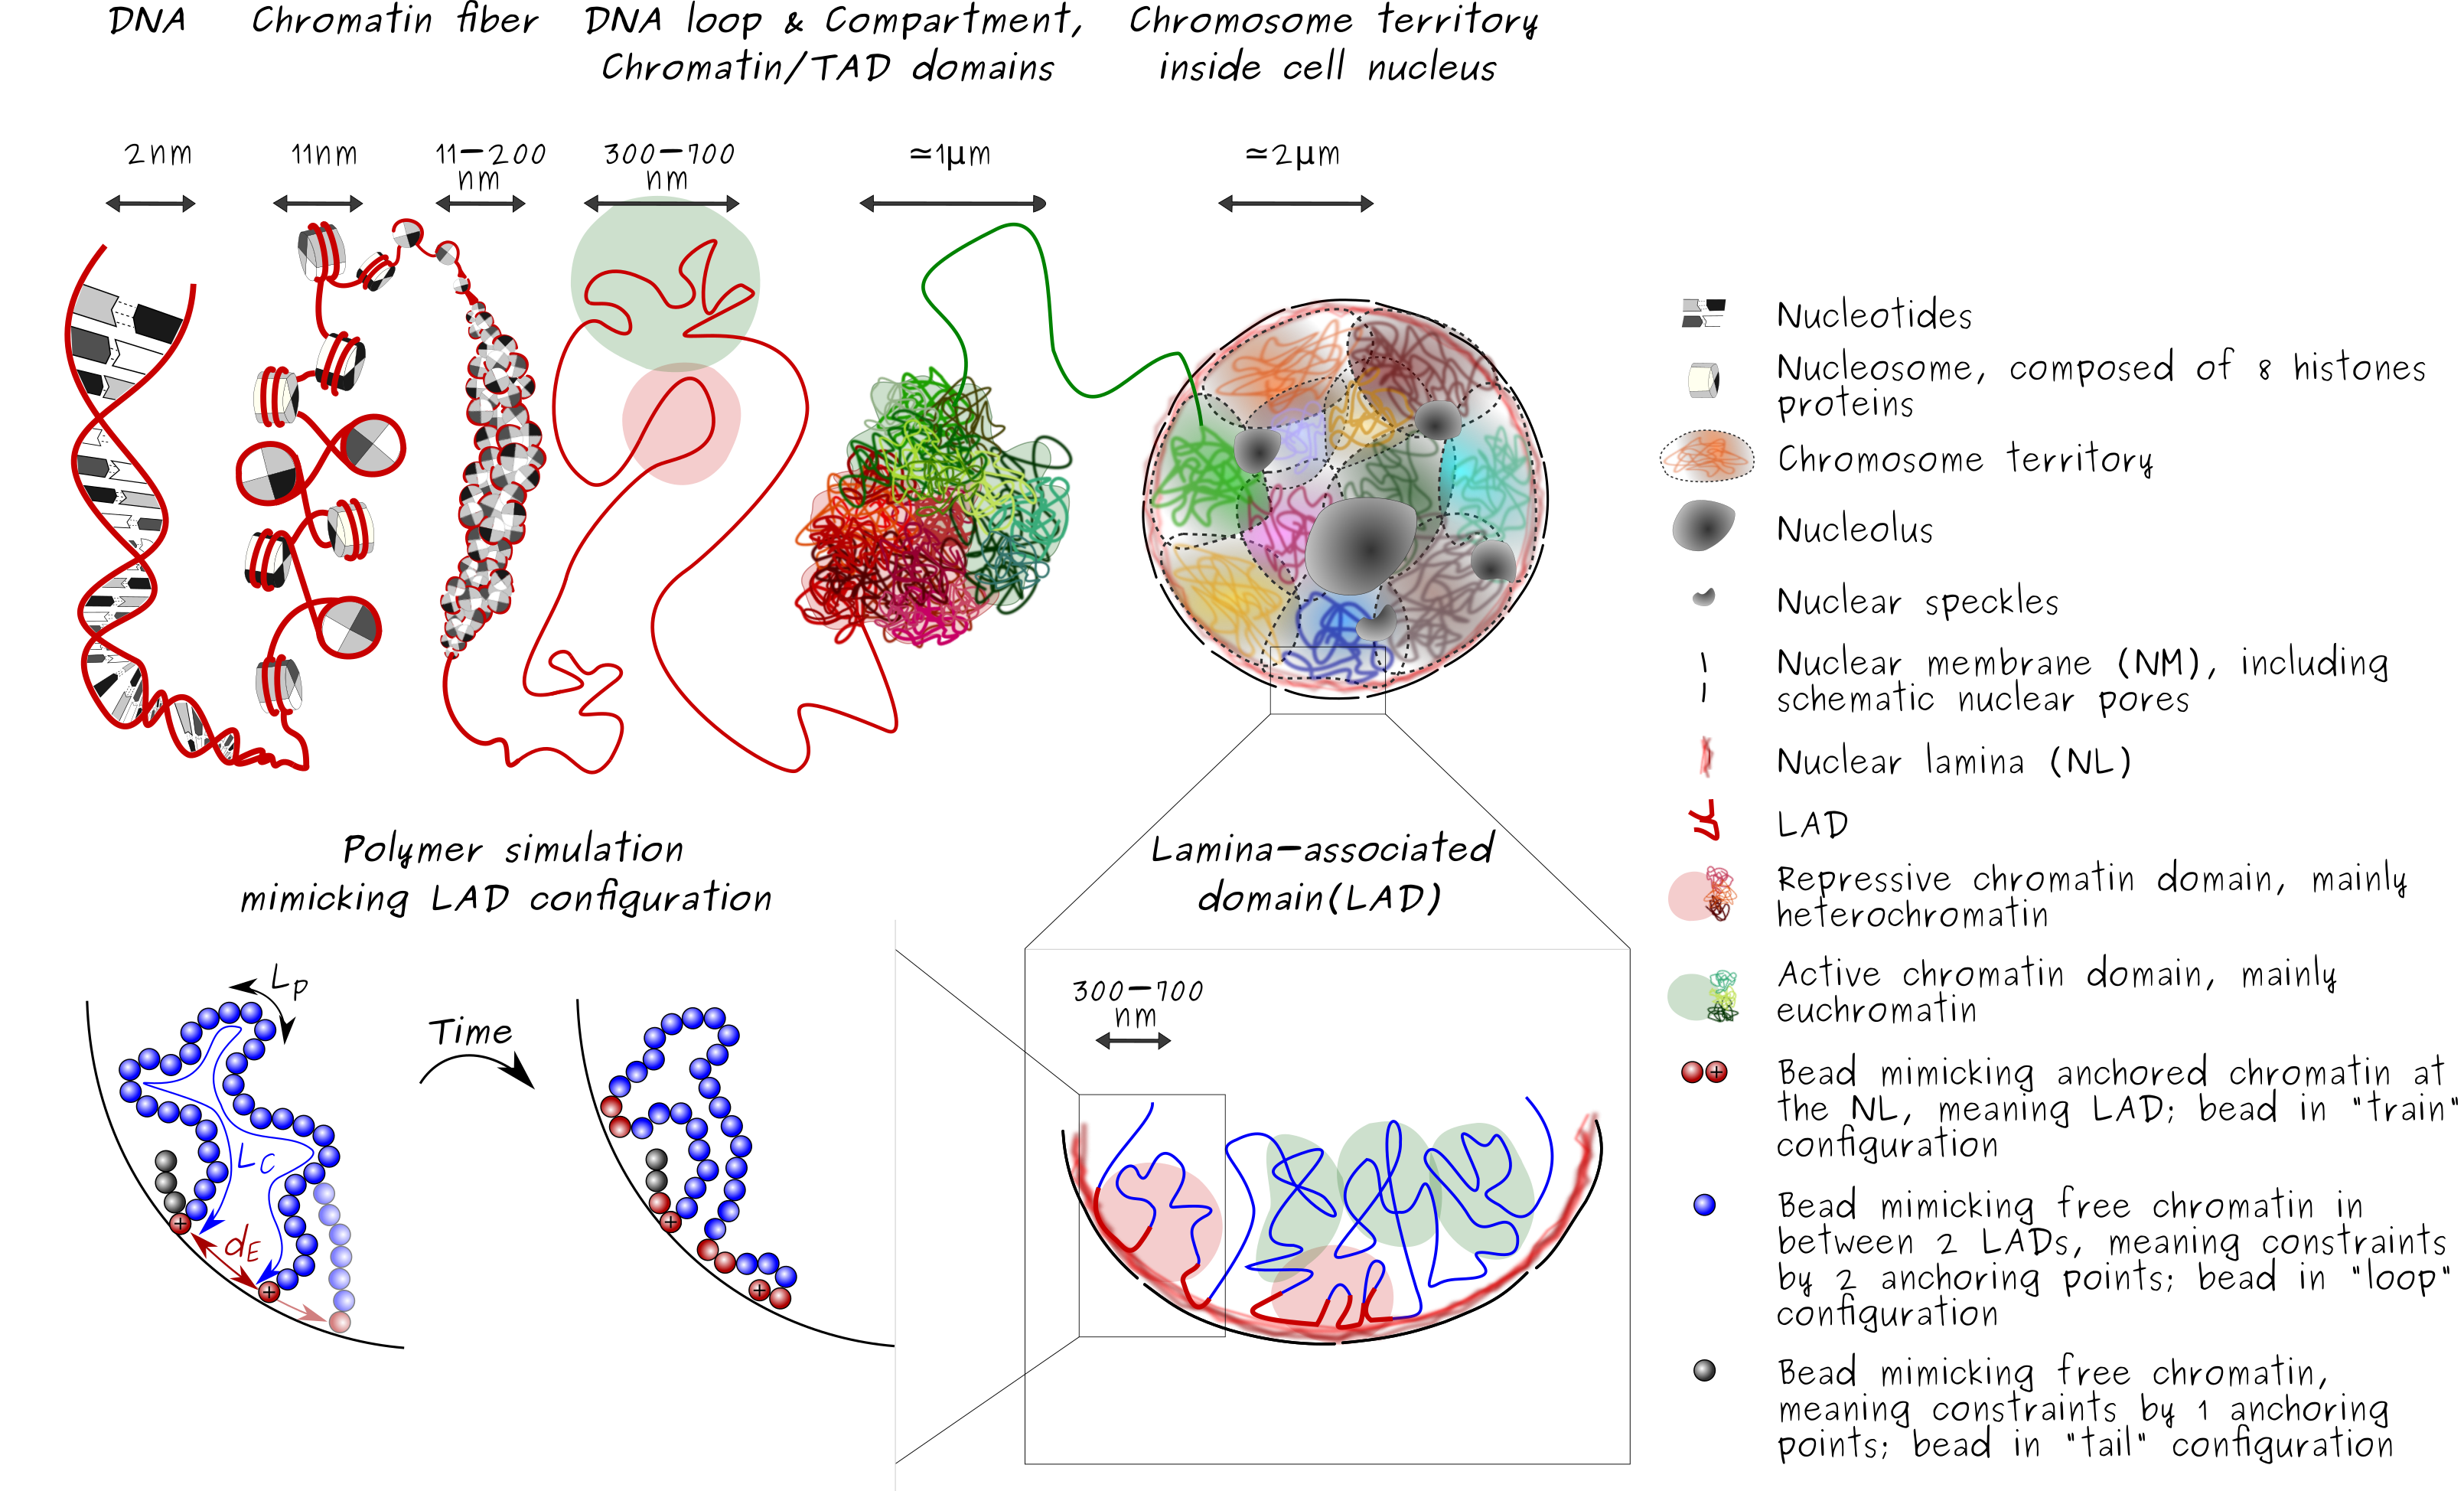
The genome is also radially organized (canter-to-periphery positioning), with lamina-associated domains (LADs) anchoring chromatin to the nuclear lamina, at the nuclear periphery (Guelen L., et al.). The nuclear lamina, a meshwork of A-type lamins [lamins A and C], products of the Lmna gene, and B-type lamins [lamins B1 and B2], encoded by the Lmnb1 and Lmnb2 genes respectively, at the nuclear periphery (Burke B., and Stewart C.L.,) also constitute one mechanism of regulation of gene expression (van Steensel B. and Belmont A.S.). As such, lamin-chromatin interactions play an important role in the radial positioning of loci in the nucleus. LADs are typically 0.1–10 mega-bases (Mb), gene-poor, enriched in heterochromatin and display low gene activity. Regions of chromatin interacting with lamins, so-called lamina-associated domains (LADs), are typically heterochromatic and relatively well conserved between cell types (Peric-Hupkes et al.,). However, other LADs are variable and altered during differentiation (Peric-Hupkes et al.,). It remains however unclear to what extent variable LADs arise and disappear as a consequence of regulatory mechanisms or through random interactions of chromatin with nuclear lamins. Whether individual loci or broader domains such as LADs display oscillatory interactions with nuclear lamins has also to our knowledge not been addressed.
Modeling of 3D genome conformation
Past decades computational approaches to model the human genome in 3D have increase. Those models explore news fundamental aspects of higher-order chromatin conformation and more and more models tent to implement time dimension to study the dynamics of various process.
Local3D : local modeling approaches to probe dynamics of LADs formation
In order to probe the dynamic of LAD formation, here we propose a new numerical model based on Monte Carole algorithm mimicking chromatin-lamins interaction appearing at the nuclear periphery.
The internal structure of the chromatin fiber is not considered at this level of modeling. In addition, the polymer motion is limited to the interior of the nucleus, impose by hard-wall boundary conditions and the first joint is considered as a freely rotative joint to the nuclear periphery.
Chrom3D : global modeling approaches recapitulating 3D genome conformation
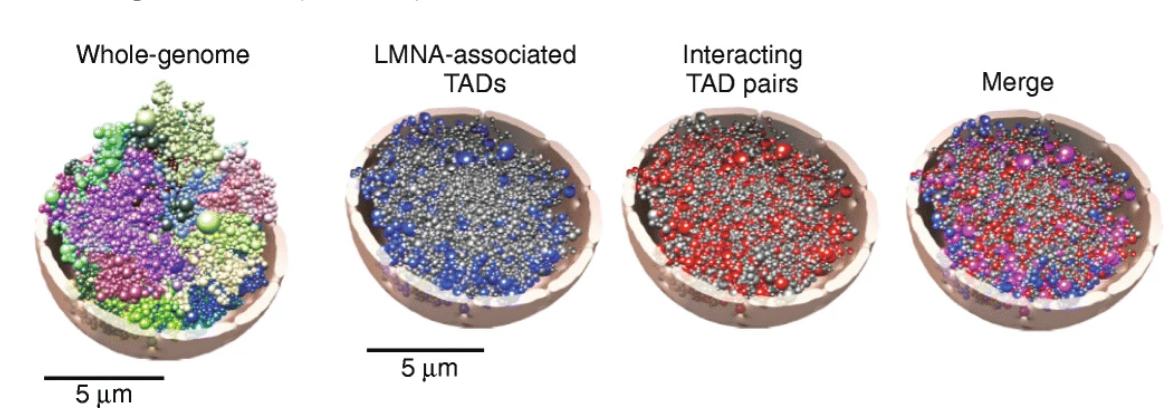
UIO, in Oslo, has a recognized expertise in Chrom3D, (Jonas P. et al.), a computational 3D genome structural modeling framework to integrate TADs and LADs constraints. TADs constraints defines the size of beads, which is proportional to the genomic size of TADs, and intrachromosomal interactions corresponding to significant pairwise TAD-TAD interactions (both identified from Hi-C data). In addition, LADs constraints define the radial positional constraints (center-to-periphery) based on the association of TADs with nuclear lamina (identified from lamin ChIP-seq data). All the beads are within a sphere of given radius equal to 5μm mimicking cell nucleus
Chrom3D is based on Monte Carlo optimization with the goal of minimizing a loss-score function. The optimization process starts from random self-avoiding chromosome structures. The result of one simulation is a 3D modeled structure of the entire human genome where the concept of chromosome territories is respected and TADs(beads) including LADs constraints tend to be more peripheral.
Differential anchoring strength of lamins protein to DNA at the NM
Lamins A and B proteins can form LADs that overlap but can also be distinct, suggesting redundant but also complementary roles of A- and B-type lamins in the modulation of radial genome conformation. To address the relationship between CsA drug exposure (drug-induced hepatotoxicit) and genome organization, we examined here the effect of CsA on the association of chromatin with nuclear lamina.
Western blot analysis shows that exposure of HepG2 cells to CsA did not alter levels of lamins A/C and B1; however CsA elicited significant pre-lamin A accumulation. Accumulation of pre-lamin A at the nuclear envelope however suggests that interactions of chromatin with the nuclear lamina could be altered
To determined whether LADs were remodeled in CsA-treated cells. We mapped laminB LADs (from here on called ‘B-LADs’) and lamin A LADs (‘A-LADs’) by chromatin immunoprecipitation-sequencing (ChIP-seq) of lamin B1 and lamin A/C, respectively. To further investigate the relationship between A-LADs and B-LADs, we divided these into LAD classes associated with lamin A only, lamin B only and both lamins A and B (‘A-only’, ‘B-only’ and ‘A-B’ LADs) and analyzed the properties of these LADs in control and CsA-treated cells.
In addition, the fate of these LADs is followed using an alluvial graph representation of the extent to which A-only, B-only and A-B LADs remained unaltered or turned into another LAD class with CsA. This analysis shows that (i) A-B LADs mostly remain ‘A-B’ while a smaller fraction loses lamin A to become B-only. (ii) Strikingly, most A-only LADs lose lamin A and become inter-LADs while the remaining switch to B-only or become A-B. (iii) B-only LADs mainly remain B-only, while ~30% turn into A-B, demonstrating a de novo acquisition of lamin A on B LADs. (iv) De novo A-only and B-only LADs appear in inter-LAD regions, albeit in minor proportions. LAD dynamics is overall unlikely to be driven by transcriptional changes.
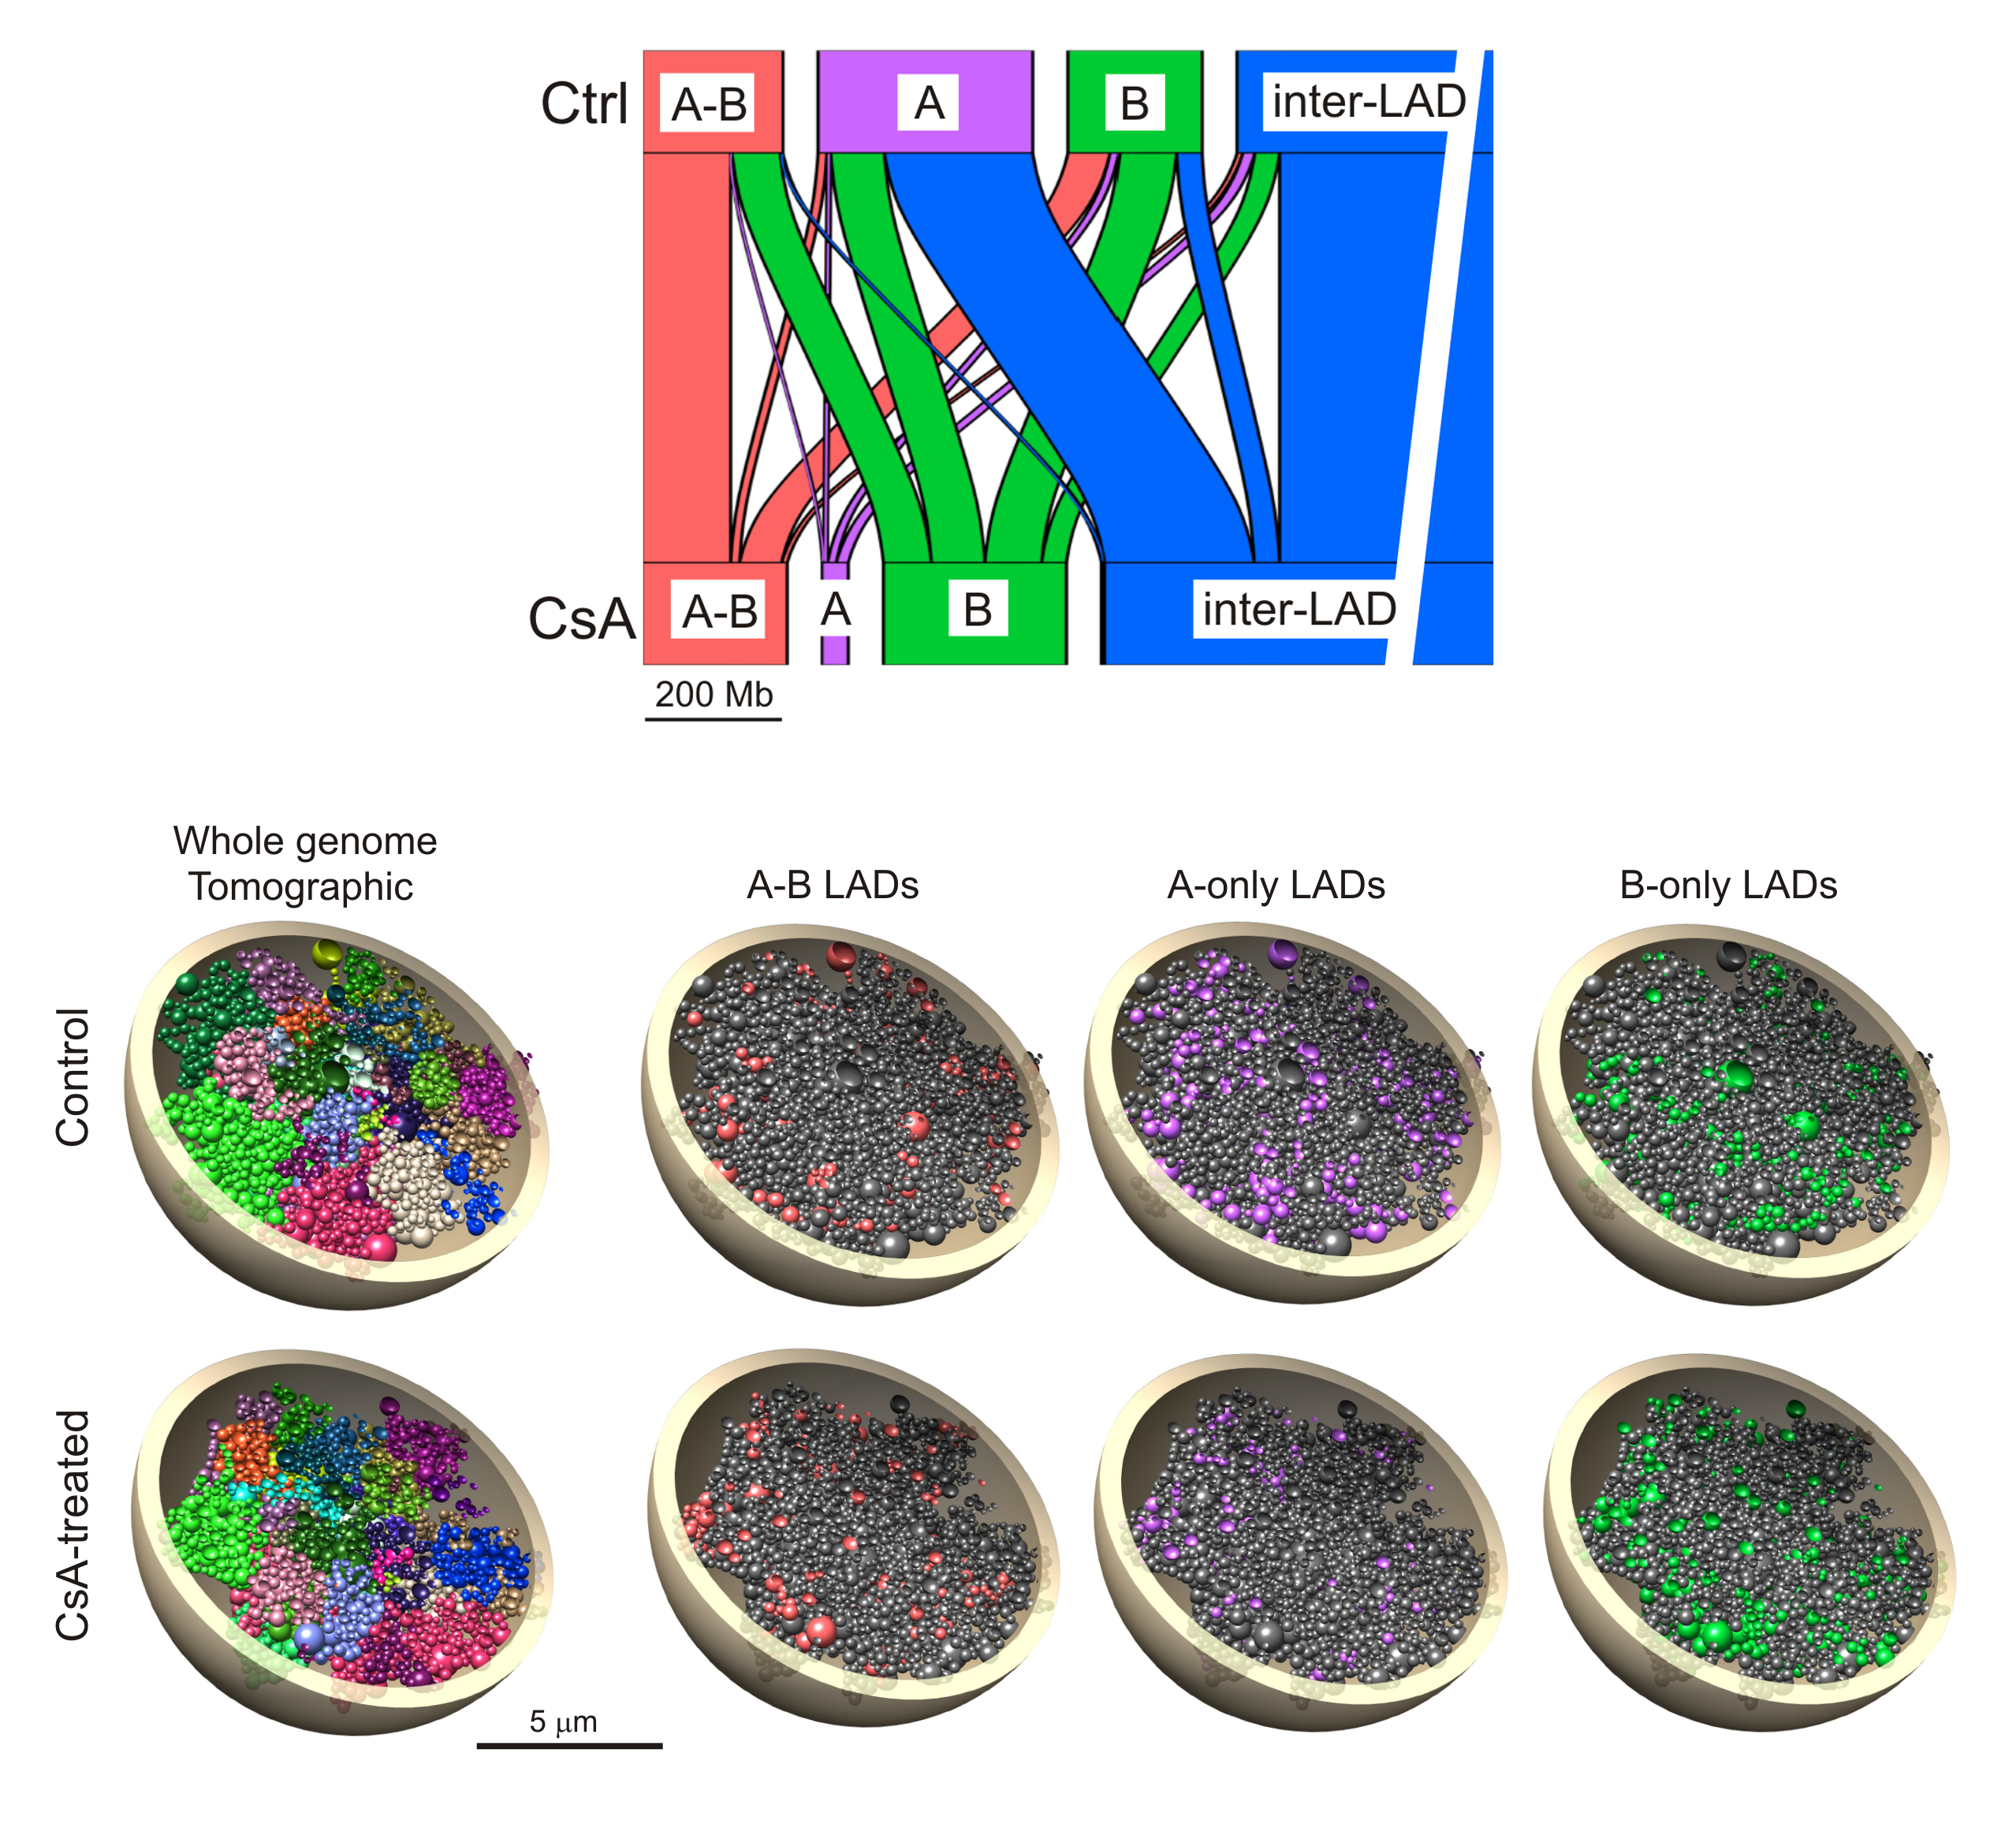
To assess whether a gain or loss of LAD or a change in LAD identity would coincide with change in the radial positioning of these domains, we generated 3-dimensional (3D) models, using Chrom3D modeling, of the HepG2 genome and analyzed properties of the models. Analysis of the models shows that A-B, A-only and B-only LADs are as expected more peripheral than inter-LADs, and between LAD classes, A-only LADs are more centrally placed than A-B or B-only LADs. We next estimated the radial repositioning of each LAD class according to their fate in CsA-treated cells. Loss of lamin association altogether correlates with repositioning of loci towards the nuclear center. Moreover, retention of a LAD class does not result in significant repositioning.
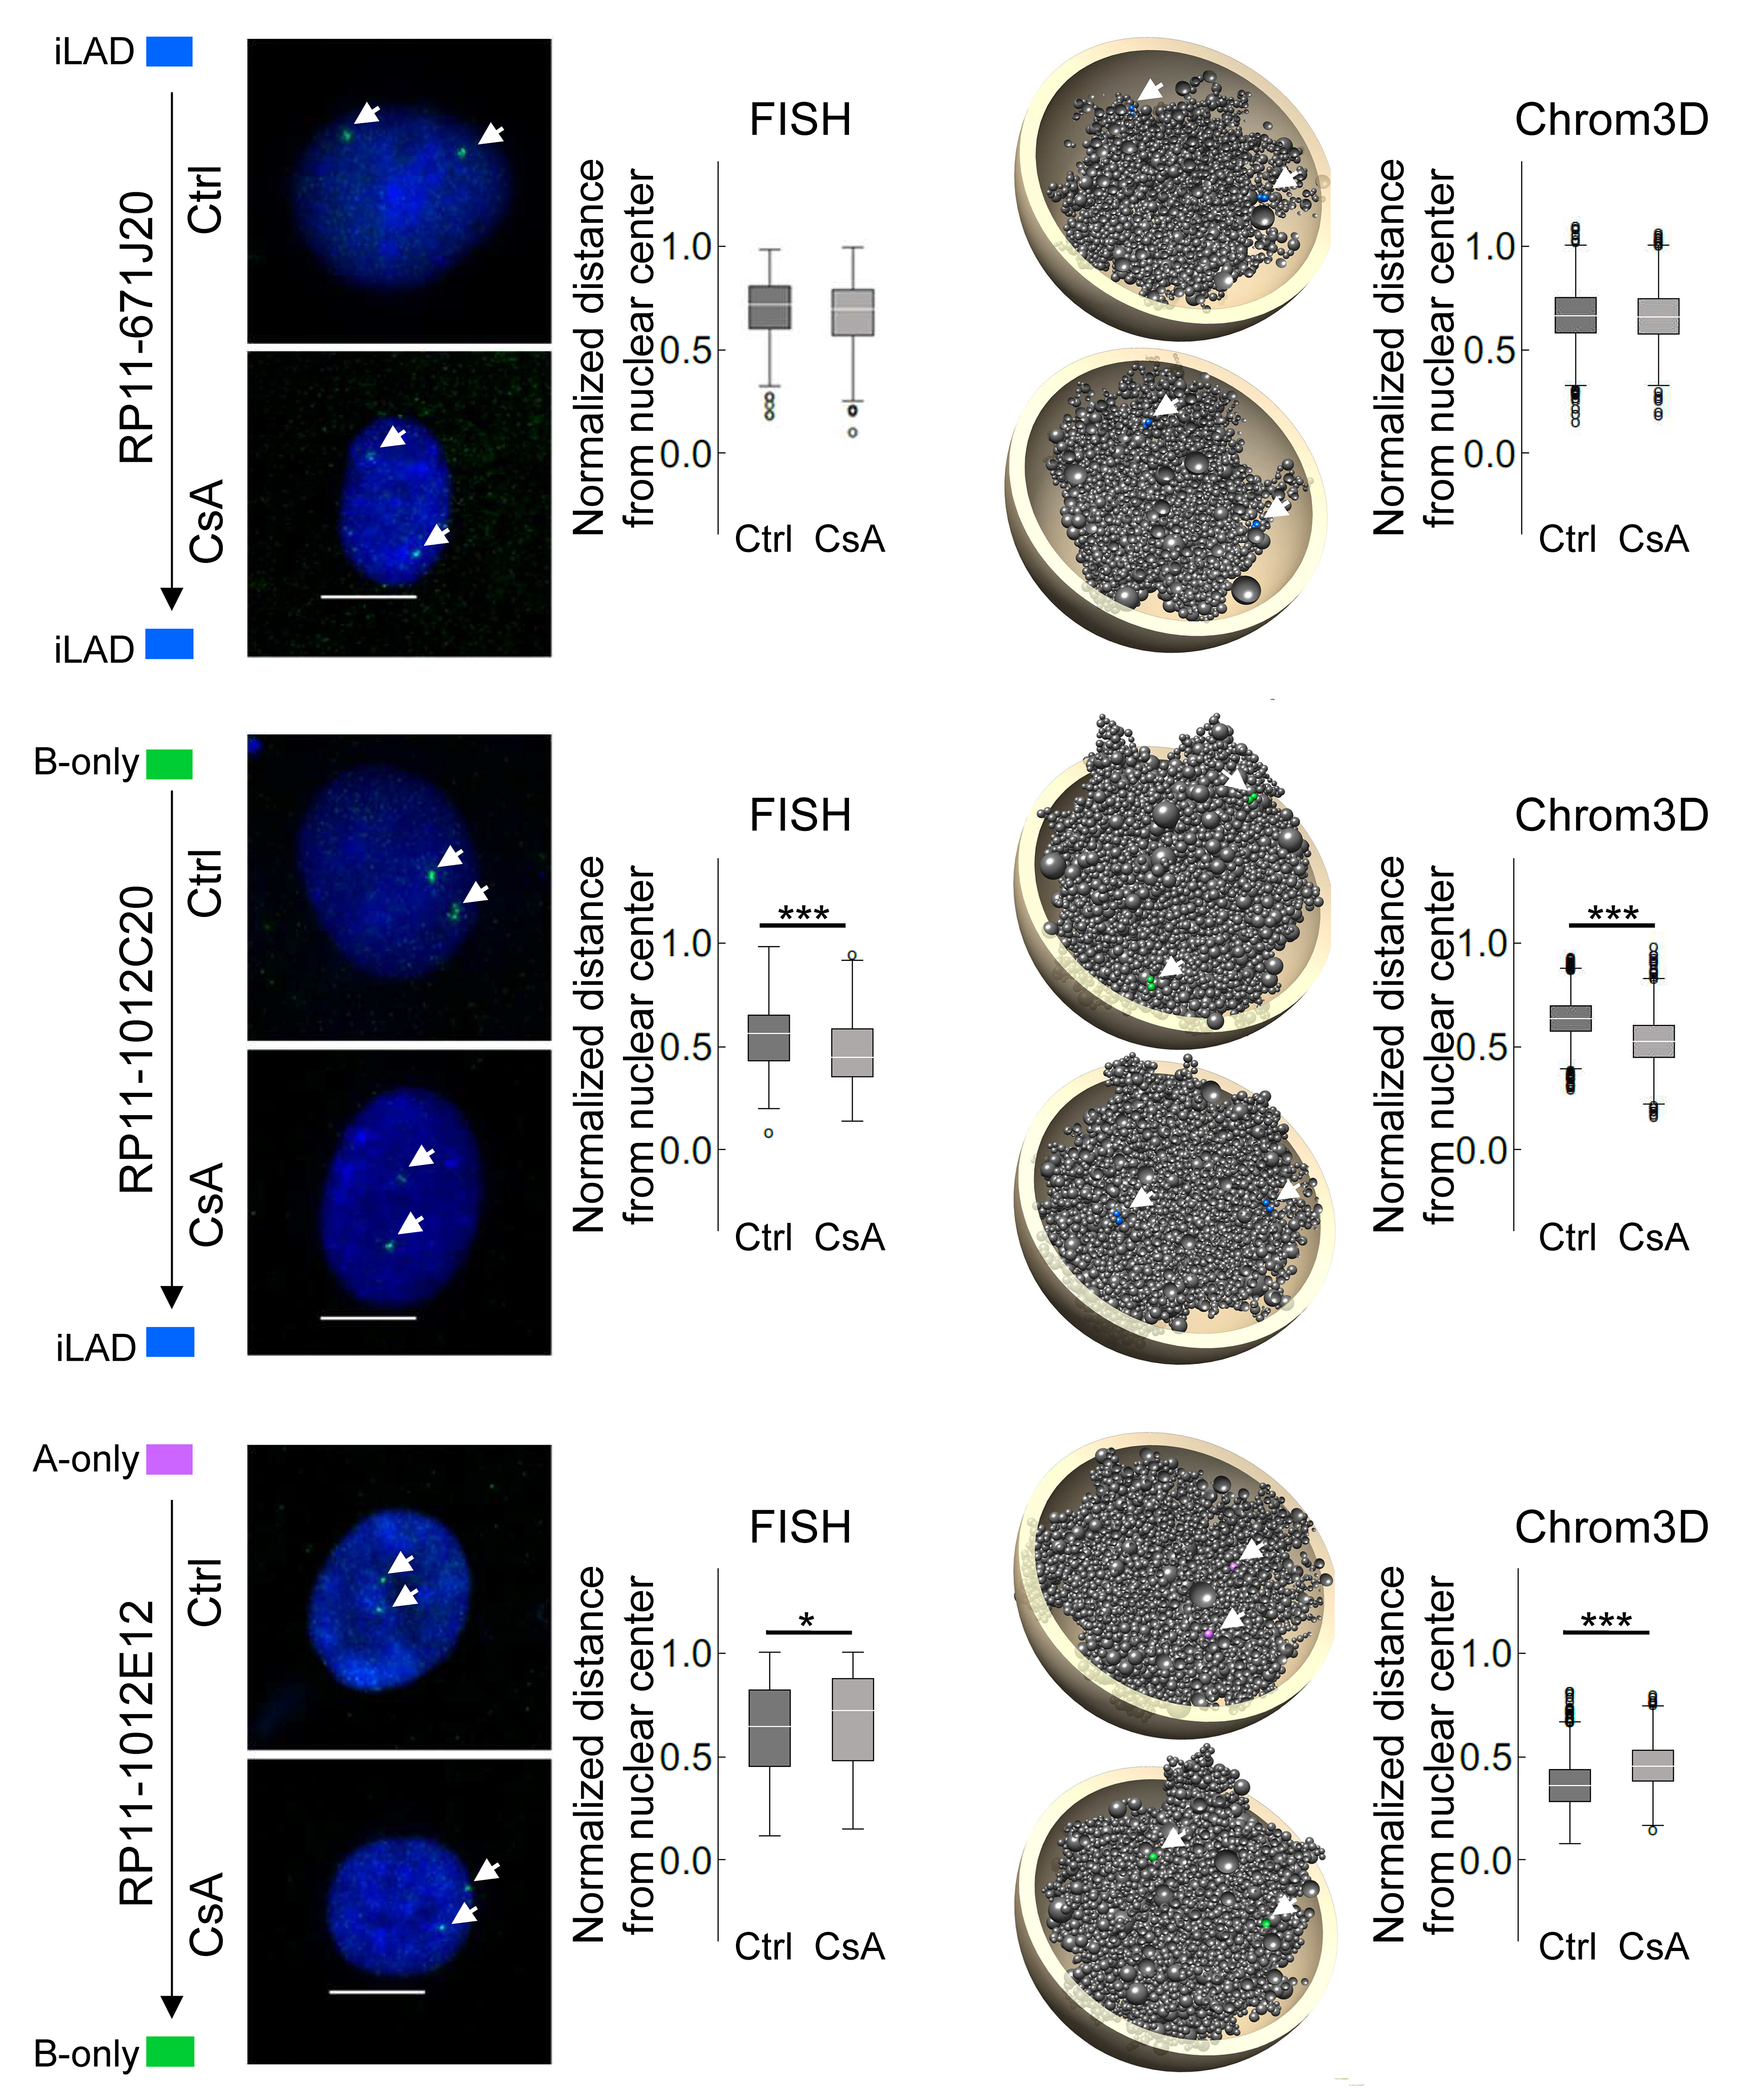
To independently validate Chrom3D model predictions on locus repositioning, we designed FISH probes to loci found in specific LAD classes in the ChIP-seq data. We also positioned in Chrom3D models the loci targeted by each FISH probe and measured their distance from the nucleus center. FISH analysis shows that maintenance of an inter-LAD does not alter radial positioning, consistent with modeling predictions. Similarly, we observe no repositioning after formation of A-B LADs from A- or B-only LADs, or after loss of an A-only LAD. However, loss of a B-only LAD reveals locus-dependent repositioning towards the nuclear center. Lastly, a switch from an A-only to B-only LAD correlates with peripheral locus repositioning. All of this validate model predictions.
Results suggest that a key contributor to A-B LAD stability is lamin B, which appears to be more stably associated with chromatin than lamin A. In other words, a gain of lamin B1-chromatin association is the main predictor (over lamin A/C) for radial positioning of genomic loci towards the nuclear periphery.
Find the detailed study in the publication :Forsberg, F., Brunet, A., Ali, T. M. L., Collas, P., Interplay of lamin A and lamin B LADs on the radial positioning of chromatin, Nucleus, DOI: 10.1080/19491034.2019.1570810. Clic here for the pdf
Oscillating pattern of DNA-lamins interactions at the NM
Many mammalian genes exhibit circadian expression patterns concordant with periodic binding of transcription factors, chromatin modifications, and chromosomal interactions. Here we investigate whether chromatin periodically associates with nuclear lamins.
Circadian rhythm
Thousands of mammalian genes exhibit autonomous oscillatory patterns of expression concordant with the circadian (24 h) rhythm (Hastings et al.). The circadian rhythm is governed by central and peripheral clocks, respectively in the nervous system and in individual organs including adipose tissue, lungs and liver, controlled by transcriptional and translational negative feedback loops (Takahashi, J. S.). The core clock is regulated by the CLOCK and BMAL1 transcription factors (TFs) which drive expression of clock-controlled genes including Per, Cry, Nr1d1/Nr1d2 (encoding REV-ERB alpha/beta proteins, respectively), and Ror genes (encoding ROR alpha/beta/gamma), by binding to E-boxes in their promoters. The PER-CRY repressor complex inhibits activity of CLOCK–BMAL1, lowering transcription of Per and Cry and generating a negative feedback loop. RORs and REV-ERBs act as activators and repressors, respectively, of Arntl (also called Bmal1) and other clock genes, driving their rhythmic transcription. Stability of PER and CRY proteins is regulated by post-translational modifications leading to their time-dependent degradation, enabling a new cycle of CLOCK–BMAL1-driven gene expression
RNASeq and LaminB1-ChIPSeq
To entrain the circadian clock, mice were subjected to 24 h fasting and refed ad libitum from circadian time CT0 (Tahara et al.,). Livers were collected every 6 h until CT30, and from non-synchronized (NS) mice 18 h before the fasting period. Procedures were approved by the University of Oslo and Norwegian Regulatory Authorities. Total RNA was isolated from livers of five mice at each CT. Transcript level and differential gene expression were estimated and determined. Moreover, ChIP of LMNB1 was done for liver pieces. LMNB1 ChIP-seq and input reads were mapped and mapped reads were used to call LADs.
Metacycle tool
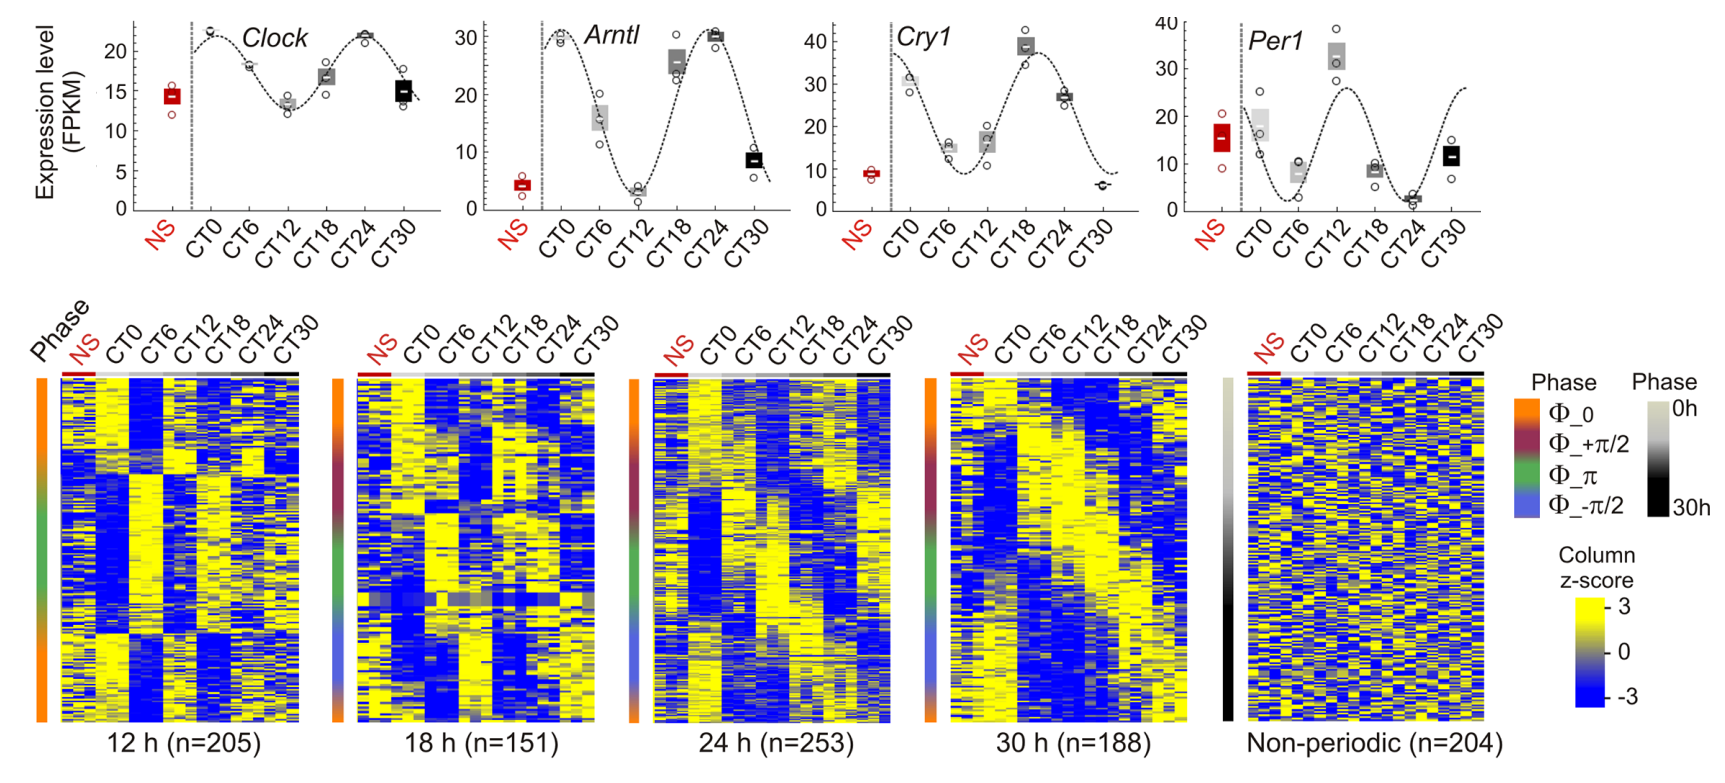
We used MetaCycle, (Wu G. et al.) to identify genes with periodic expression patterns from RNA-seq data generated in biological triplicates at each CT. MetaCycle measures the goodness-of-fit between RNA-seq FPKM and cosine curves with varying periods and phases. The extrapolated periodic function best fitting the data is selected and significance is determined (Fisher’s exact tests) after scrambling FPKM values. From the period distribution for all 17,330 expressed genes in liver (expressed at least at one time point), we focused on oscillations with 12, 18, 24, and 30 h periods (each ± 3 h, half the time resolution in our study)
Entrainment of the clock was confirmed by periodic expression of the core clock genes Clock, Arntl (Bmal1), Cry1, Per1, and Nr1d1, assessed by RT-qPCR and RNASeq analysis of their periodicity using MetaCycle tool. We find that nearly 20% of oscillations are circadian (24 h period; 3,046 genes), and thousands of genes oscillate with periods within the circadian rhythm and beyond, in line with previous reports (Zhu B. et al.). Among these, a subset displays highly significantly oscillating transcripts. Within a given period, mRNA oscillations occurred with distinct phases : oscillations are in phase (Φ = 0, time at first maxima) and opposition of phase (Φ = Π), and for 18, 24, and 30 h periods, are also offset by one-quarter cycle (Φ = 1/2 Π and Φ = -1/2 Π). Significantly periodic genes include the core clock genes. We also defined a set of 204 “non-periodic” genes with mRNA levels discordant (1 > P > 0.9999) with any cosine curve tentatively fitted by MetaCycle.
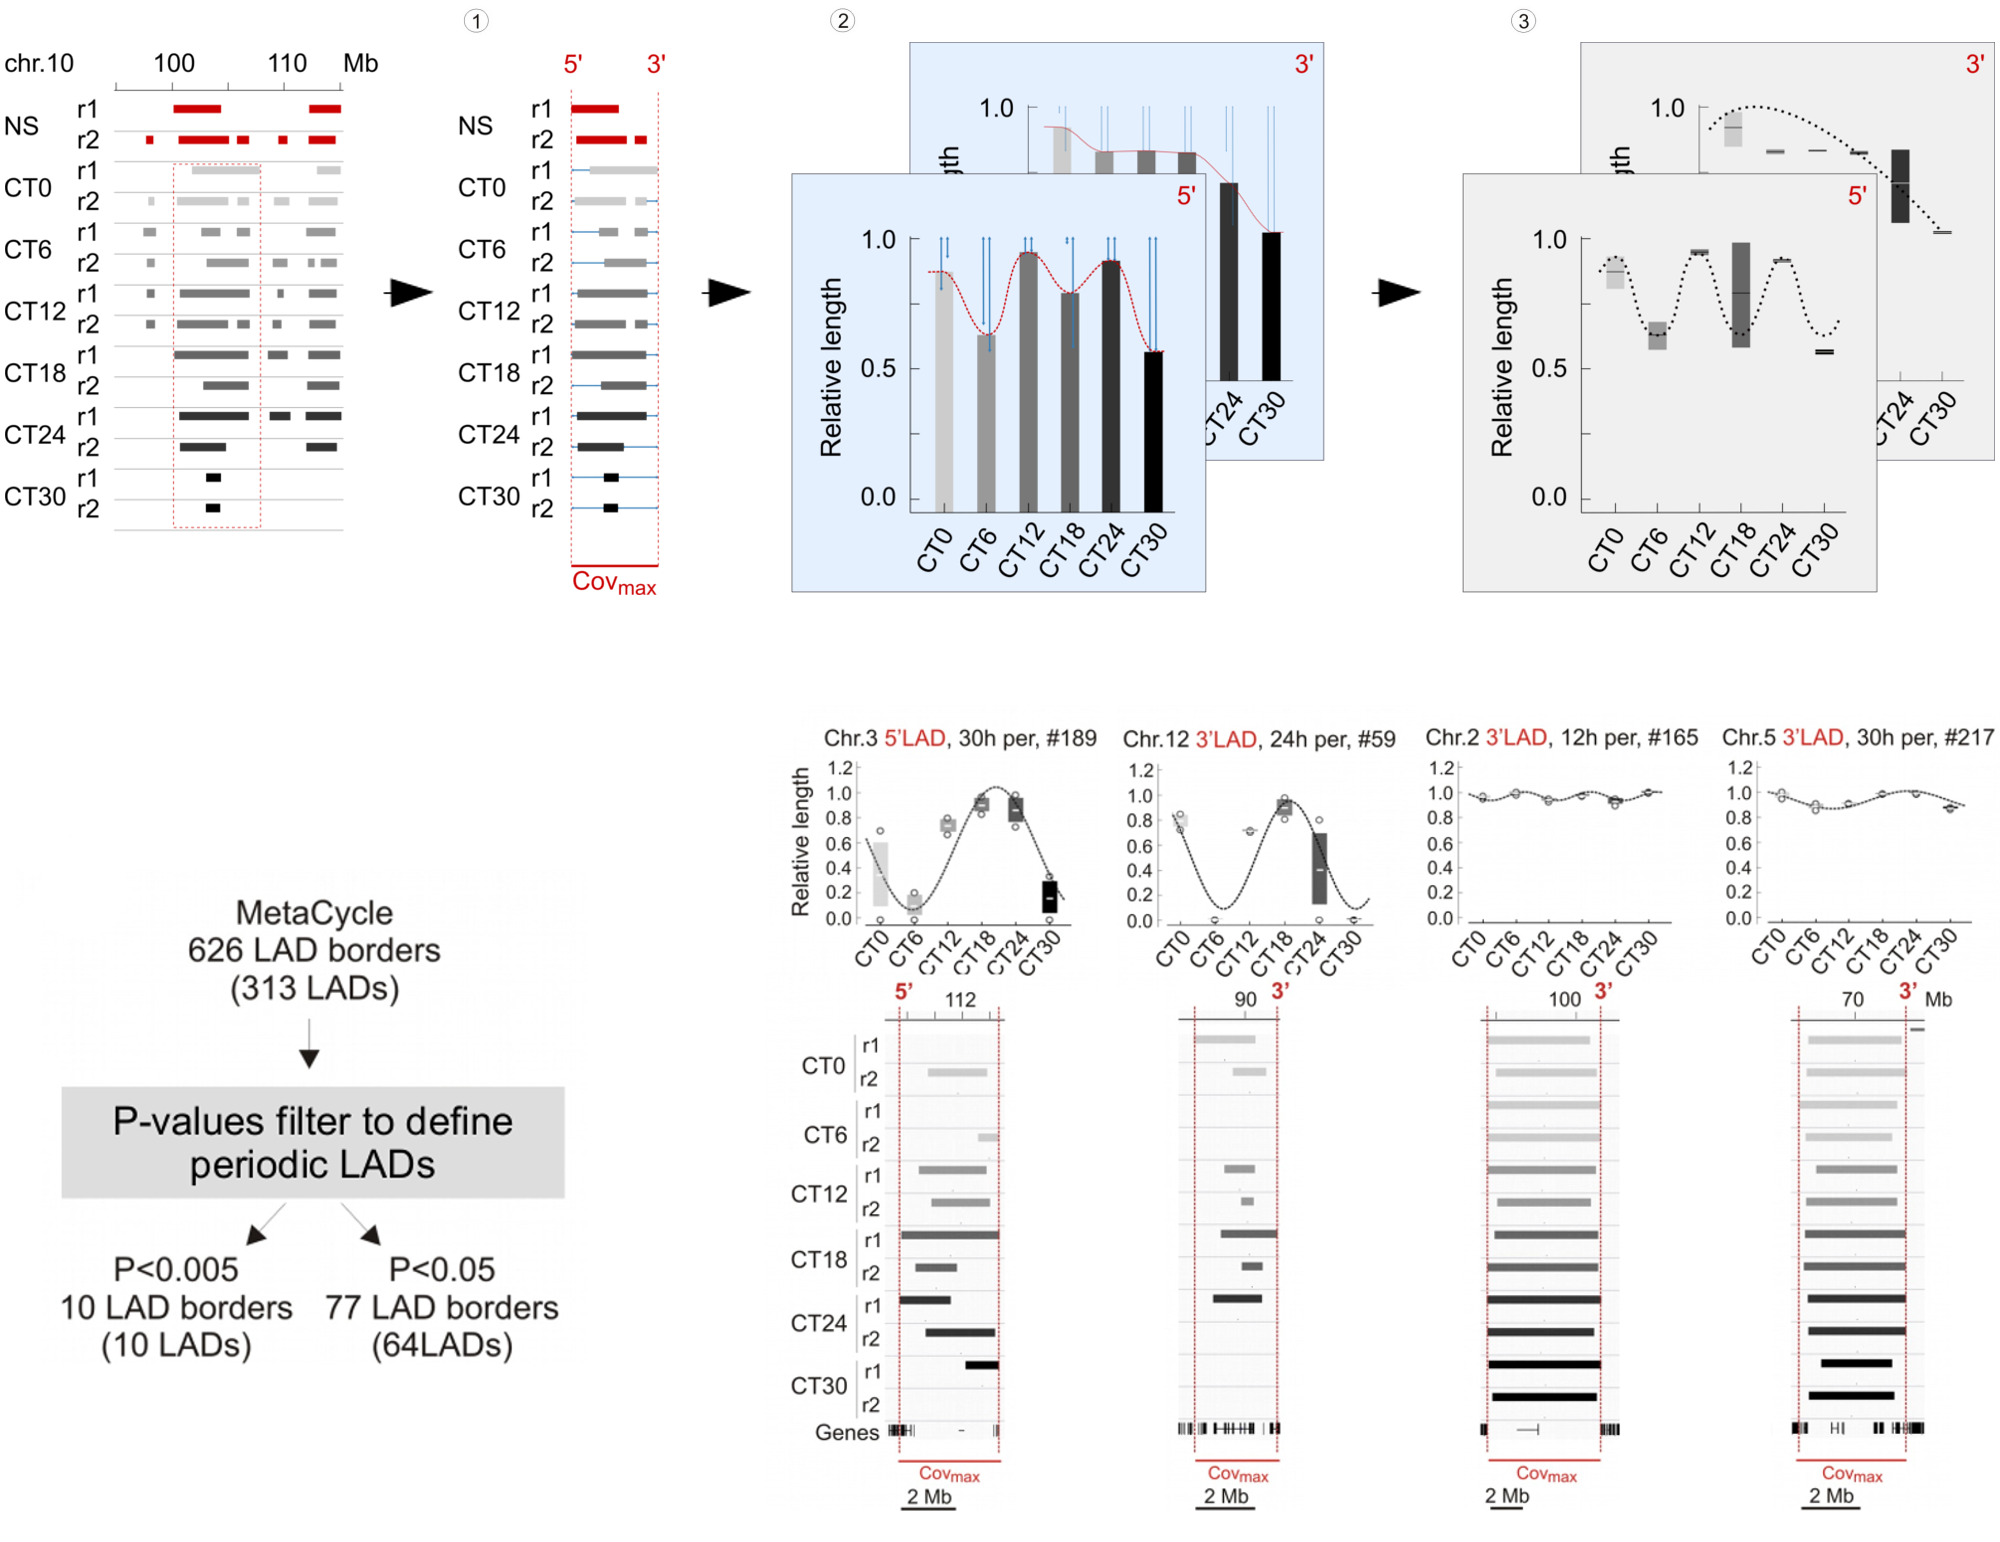
We next examined variations in LADs more closely during the circadian cycle. These occur by LAD extension or shortening, sometimes resulting in a fusion or splitting of LADs, or by formation and dissociation of entire LADs. We therefore devised a strategy to quantitatively characterize the genomic coverage of these variable LADs over time. We determined for each LAD the maximal genome coverage (covmax ) in the CT0–CT30 time course as the union of LAD coverage across all replicates and CTs, and ascribed to covmax a reference value of 1 (see panel 1 of the following figure). The 5′ and 3′ boundaries of this covmax area provided genomic coordinates for measures of variations in LAD length within this area. For each CT and replicate, variable 5′ and 3′ LAD lengths were extracted and standardized from 0 to 1 (covmax ), 0 referring to the complete disappearance of a LAD, and 1 corresponding to the entire LAD being present over the whole covmax area (see panel 2 of the following figure). We then used MetaCycle to identify any periodicity in the extension or shortening of LADs within the covmax area (see panel 3 of the following figure), where MetaCycle applied a cosine curve best-fitting genome coverage variations at the 5′ and 3′ end of LADs. Ascribing a stringent P value of < 0.005 (Fisher’s exact test; as in our MetaCycle RNA-seq analysis) returns 10 highly significantly periodic LADs with periods distributed throughout the circadian cycle (see lower left panel). Relaxing the P value to P < 0.05 expectedly increases the number of periodic LAD borders to 77 (30 5′-periodic, 47 3′-periodic, and 13 both 5′- and 3′-periodic) among 64 distinct LADs. However, inspection of the profiles of these LADs revealed, for some of them, discrepancy with the best curve fitted by MetaCycle. This led us to focus our subsequent analysis on the 10 LADs identified above at P < 0.005, which we hence forth refer to as periodic LADs (see lower right panel).
We conclude that there is no correlation between periodicity in gene expression and variation in gene-to-nearest LAD distance. Moreover, the central clock-regulating genes are typically megabases away from the nearest LAD, and promoter regions of these genes are also essentially devoid of LMNB1 interaction at any CT
Find the detailed study in the publication : Brunet, A., Forsberg, F., Fan Q., Sæther T., Collas P., Nuclear Lamin B1 Interactions with Chromatin during the Circadian Cycle Are Uncoupled from Periodic Gene Expression, Frontiers in Genetics, DOI: 10.3389/fgene.2019.00917. Clic here for the pdf
Local modeling of LAD formation dynamics
Interactions of chromatin with the nuclear lamina imposes a radial genome distribution important for nuclear functions. How physical properties of chromatin affect these interactions is unclear. We used polymer simulations to model how physical parameters of chromatin affect its interaction with the lamina. Impact of polymer stiffness is greater than stretching on its configurations at the lamina; these are manifested as trains describing extended interactions, and loops describing desorbed regions . Conferring an attraction potential leads to persistent interaction and adsorption-desorption regimes manifested by fluctuations between trains and loops. These are modulated by polymer stiffness and stretching, with a dominant impact of stiffness on resulting structural configurations. We infer that flexible euchromatin is more prone to stochastic interactions with lamins than rigid heterochromatin characterizing constitutive LADs. Our models provide insights on the physical properties of chromatin as a polymer which affect the dynamics and patterns of interactions with the nuclear lamina.
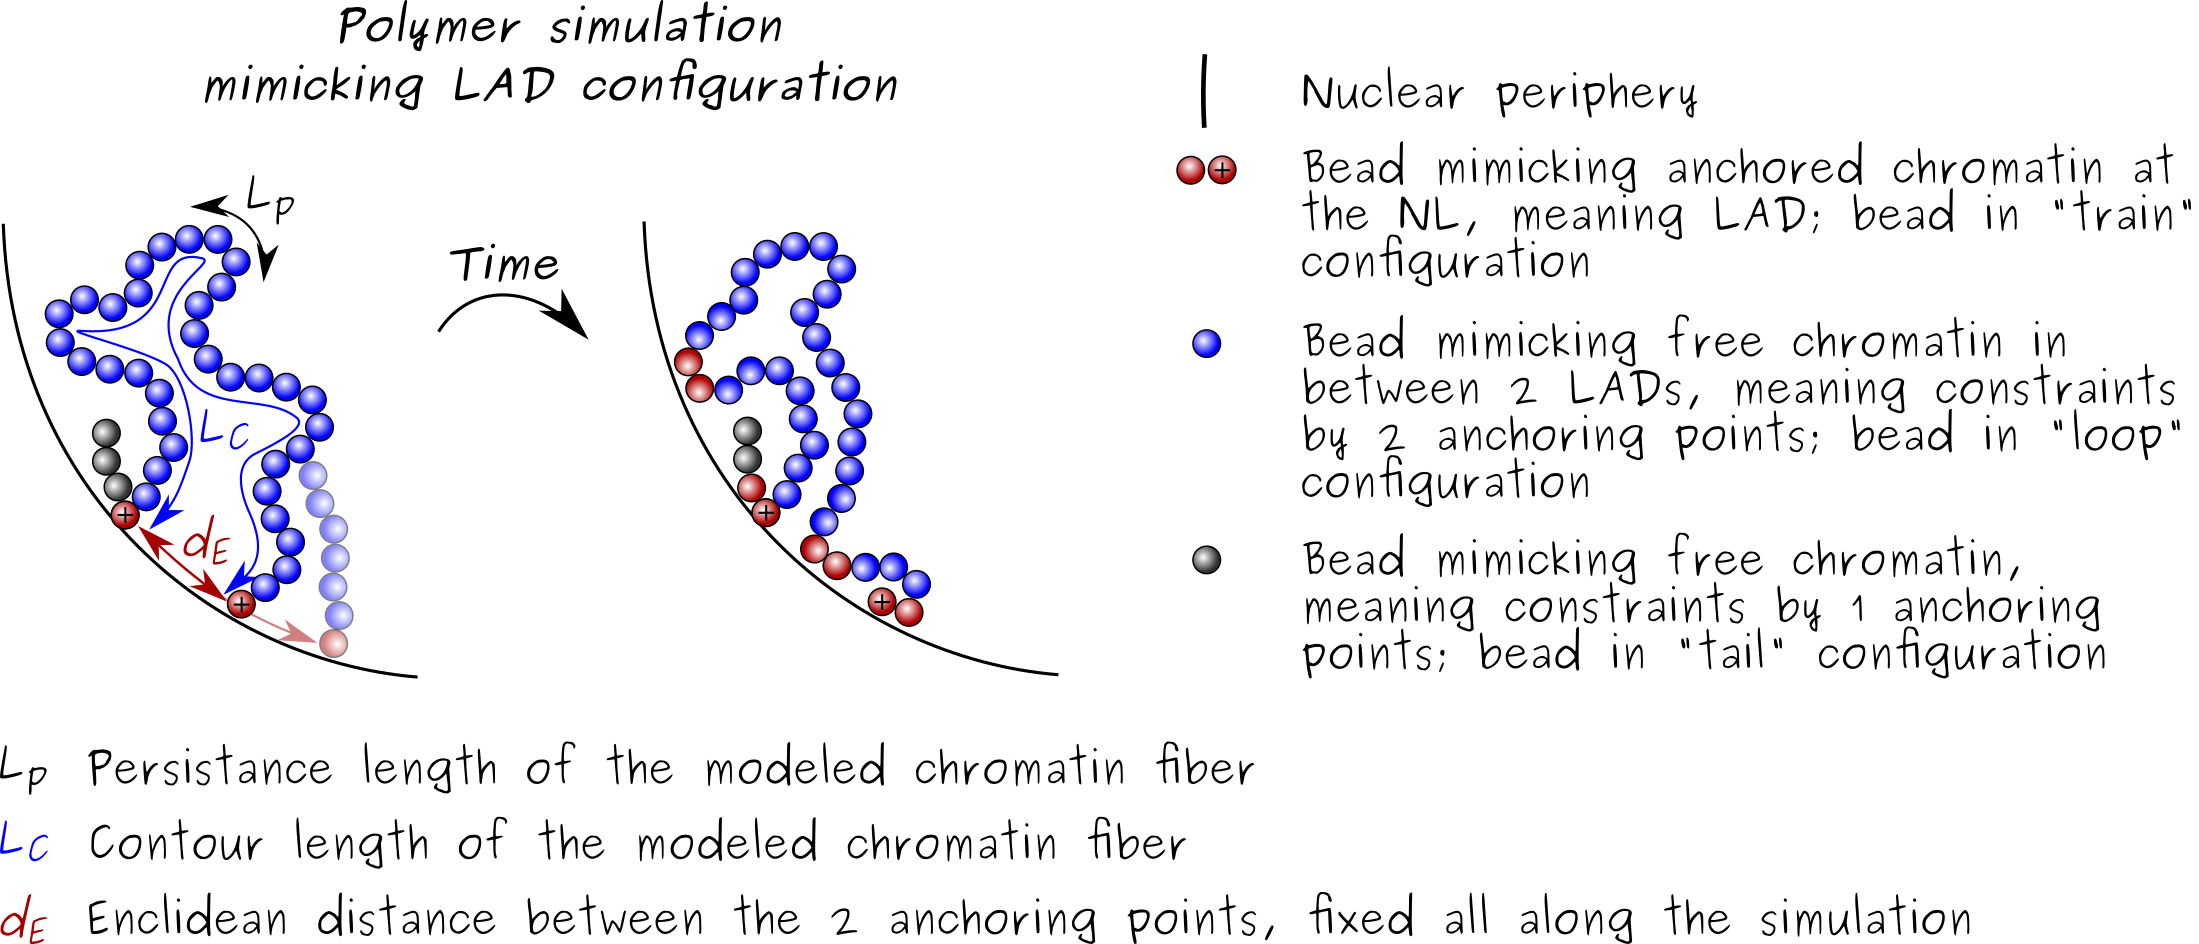
Our modeling is based on a self-avoiding polymer model at the genomic length scale of a sub-LAD segment at the nuclear lamina. Chromatin is modeled as a polymer (or chain) of 12 beads pinned by one anchor or two anchors to a surface NP (curved surface) representing the nuclear lamina. The chromatin polymer is characterized by its contour length LC (here 360 nm), its persistence length LP defining its bending property (stiffness), and the Euclidian distance dE between the two anchors along NP. During Monte Carlo simulations, the polymer may change configuration (arrow) with respect to NP to adopt tail, train and/or loop configurations. Considering the genomic scale examined (~50 kb), we model chromatin behavior at the nuclear lamina at a sub-LAD scale with anchor points recapitulating chromatin interactions with lamins within a LAD
We have examined to what extent the physical properties of a polymer modeling a chromatin segment at kilobase scale influence interactions with a surface NP representing the nuclear lamina. We show a dominant effect of polymer stiffness over stretching on its mode of interaction with NP, and infer from our models that a flexible euchromatin domain exhibits more stochastic interactions with the lamina than stiffer heterochromatin domains characterizing cLADs. We show that conferring an attraction potential to NP is necessary to elicit long-lasting interactions, in line with modeling predictions of chromatin-lamina associations at much larger genomic scales. Tuning this potential promotes full adsorption of the chain, complete desorption, or adsorption-desorption regimes manifested by fluctuations between train and loop configurations along the chain.
Physical considerations of our models
In a desorption regime, loops merge with other loops or with a tail as interacting domains (trains) are released from the surface. A simple scaling argument can account for this. When the polymer is adsorbed, energy gain is in the order of N∈abskBT. For a polymer with pinned ends, entropic cost of adsorption is only caused by the loss of internal degrees of freedom as there is no translational entropy when the polymer is desorbed. Entropy loss is in the order of NKkBT, where NK=LC/(2LP ) is the number of Kuhn segments in the chain. In a rigid polymer (LC ≤ LP ), this entropic cost is in the order of kBT. Under these conditions, adsorption is favored when ∈ads≥1/N, which sets a lower εads threshold leading to adsorption. With two anchors, increasing the Euclidian distance dE between them favors adsorption even for a flexible polymer and with a weak attraction potential (<< kBT per bead). This can again be explained by entropy reduction under adsorption. When dE is close to the contour length LC , the chain is stretched and when desorbed, its fully accessible fluctuation modes consist of several short-range adsorbed and desorbed segments. There, entropy loss upon adsorption is in the order of a few kBT even for a flexible chain. Without attraction potential, no significant enhancement in polymer–surface interactions occurs upon stretching, confirming the central role of an attraction force, even weak, in eliciting long-lasting interactions.
We have limited our simulations to 12-bead chains to enable frequent statistical sampling with high precision. Examining longer chains would however be useful to model entire LADs. One may speculate on features of such models, considering a 2-anchor and non-stretched polymer (stretching is not the most critical parameter governing polymer behavior at NP; this study) with LP ~100 nm (a typical value for chromatin) and of contour length LC ≫ LP and dE. We anticipate that cooperative contacts with the lamina close to the anchors would similarly occur, while mid-chain contacts, reflecting chromatin–lamina interactions far away from anchors, would be more frequent. For non-stretched chains, mid-chain contact features are expected to be independent of chain length provided that it is longer than LP . Of note, our simulations with LP = 100 nm, dE = 50 nm and εads = 0.05 or 0.1 show that the most frequent outcomes are simultaneous adsorption of all beads, or 1 loop and 2 trains of typically ≤ 6 beads. Trains cannot be much shorter than LP as this would require strong bending of the chain, which is energetically unfavorable. In addition, we do not expect trains to be longer in longer chains because trains result from local cooperative bead adsorption non-correlated over long distances. Similarly, in the range of our parameters, typical loop size is ≤6 beads, which is much shorter than chain length; thus, we anticipate that increasing chain length would not significantly affect this loop size. However, in longer chains, we could expect several loops ‘sliding’ between the anchors, with several mid-chain contacts (see also below).
Biological implications of our models
Without attraction potential, only short-lived random polymer encounters with NP occur, while interactions can be modulated by tuning a potential. Our results recapitulate observations that variable chromatin-lamin contacts occur between cells in a population. In line with our models, more stable interactions, such as in cLADs, require proteins in the inner nuclear membrane, the nuclear lamina or chromatin, such as LBR, LEM-domain proteins, lamin A/C or barrier-to-autointegration factor. The attraction potential conferred to our models globally represents the range of factors required to address or anchor loci to the nuclear envelope.
Single-cell analysis of lamin B1–chromatin interaction reveals significant cell-to-cell variation in LADs. Chromatin-lamin contact frequencies vary across the genome, being lowest at vLADs and in gene-rich regions, a hallmark of euchromatin, and highest in heterochromatic and gene-poor LADs. The single-cell data are consistent with our modeling outcomes: these highlight the greater propensity of a flexible/semi-flexible chain (modeling euchromatin) to display dynamic adsorption–desorption transitions with a ‘lamina’ and to interact at multiple and non-preferred positions along the chain, than a rigid polymer. In contrast, under similar adsorption-desorption regimes, a more rigid polymer modeling heterochromatin is more prone to undergo long-lasting interactions involving larger domains. Stochasticity in configurations of flexible chromatin polymer models at the lamina therefore concords with the variability of lamin interactions in euchromatic parts of the genome. Supporting our polymer models, restrain-based 3D genome models also predict more variegated positioning of euchromatic domains at the nuclear periphery across models, recapitulating the cell-to-cell variability in lamin-chromatin contacts.
Our data argue that the interaction of a chromatin polymer with the nuclear lamina is seeded from the anchors and invokes cooperative recruitment of neighboring beads. In a nucleus context, our models are supported by observations that most of the variability of vLADs invokes extensions of already existing LADs or lamina-bound chromatin regions within LADs, rather than binding of domains distant from existing anchors. Our models infer that this cooperative recruitment is enhanced with more rigid heterochromatin domains such as those in bona fide LADs; it is also favored by polymer stretching, altogether demonstrating an interplay between attraction potential, persistence length and distance between anchors. This suggests that the physical properties of chromatin at the tens of kb scale influence the parameters required for association with the nuclear lamina. Supporting this view, local transcriptional and epigenetic environments modulate chromatin contacts with lamins.
Euchromatin, which has lower LP than heterochromatin and is therefore more flexible, can also interact with lamins. Our simulations show that a polymer of low persistence length displays more structural variability at NP than a more rigid polymer modeling a heterochromatin domain. This is manifested in our simulations by enhanced fluctuations between train and loop configurations. Similarly, the smaller LP , the greater the propensity to form multiple trains. These results concur with observations that lamin interactions with euchromatin are more variable than heterochromatic LADs.
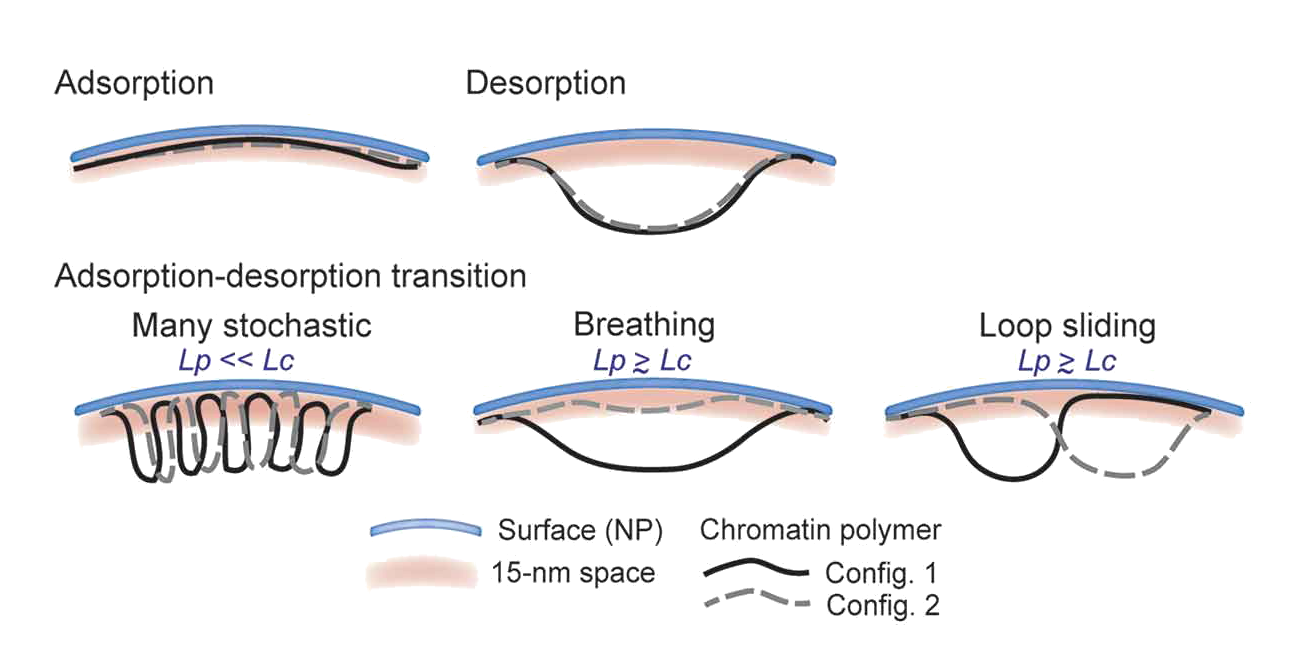
Our study at kilobase scale raises the issue of whether a LAD consists of a domain, which wholly interacts with the lamina or rather consists of smaller domains that associate/dissociate with/from the lamina within a LAD. Under conditions of adsorption-desorption regimes (fluctuations between trains and loops), our data are compatible with several models of chromatin–lamin interactions. (i) Many stochastic interactions can occur along a given polymer segment; this is only possible for flexible polymers (LP << LC ) and is supported by simulations revealing two (as opposed to one) prevailing configurations (2 trains-1 loop and 3 trains-2 loops). In a chromatin context, our simulation may therefore model lamin interactions with euchromatic sub-LAD domains, punctual sites of phosphorylated lamin A interaction with enhancers, dynamic euchromatic lamin A/C-chromatin interactions [11,36], transient euchromatin interactions with lamin B1 during the circadian cycle, or interactions of lamin B1 with gene-rich euchromatic regions in senescent cells. (ii) Repeated adsorption/desorption transitions can occur along the chain, giving rise to a polymer ‘breathing’ pattern; this view emerges from one dominant configuration (2 trains-1 loop) in simulations with stretched and semi-flexible to rigid polymers. The number of beads in these configurations is homogeneously distributed along the chain, demonstrating variability in the length of these configurations. This could plausibly model rhythmic associations of chromatin with the lamina. (iii) Lastly, a loop can form at various positions along the chain, yielding 2 trains-1 loop configurations of essentially constant lengths, suggesting a ‘loop sliding’ pattern between the anchors; this is also valid for a stretched or near rigid polymer (LP ≥ LC ). As discussed earlier, in the range the parameters explored in this study, we speculate that increasing chain length would not significantly affect the maximum loop size observed in simulations; however, in longer chains, we anticipate several loops ‘sliding’ between the anchors, with several mid-chain contacts. Altogether, our modeling data predict that transitions in chromatin configurations at the nuclear lamina are modulated by an interplay between an ‘attraction strength’ with the nuclear envelope, chromatin stiffness and Euclidian distance between existing chromatin anchors.
Find the detailed study in the publication : Brunet, A., Destainville, Collas P., Physical constraints in polymer modeling of chromatin associations with the nuclear periphery at kilobase scale, Nucleus, DOI: 10.1080/19491034.2020.1868105. Clic here for the pdf